


ARCHIVE - Forecast relative to the night starting on 2026/05/30 MST |
Note: click on a figure to magnify the image.
Date of figures refers to the start of night in MST.
Date of figures refers to the start of night in MST.
WIND VERTICAL PROFILES
Vertical profiles are computed in the [0-20km] range above ground level (a.g.l.) and centered on the LBT. Data points frequency is 2 minutes. Here are shown:- TEMPORAL EVOLUTION:
The contour plot represents the temporal evolution of wind speed vertical profiles between the sunset and the sunrise. On the x-axis is time in UT (bottom), in MST (top). Mountain Standard Time MST=UT-7. On the y-axis the height above ground level. The color scale refers to the wind intensity.

|
|
Fig. 1: Wind speed vertical profile temporal evolution between the sunset and the sunrise. Dashed lines indicate the dusk and the dawn. |
- TIME AVERAGES:
Three time averages are presented, computed in the first, central and last part of the night (see partition). The corresponding MST (MST=UT-7) is shown on the top of the figure.
The blue light halo around each average represents the +/- sigma in the respective time window.
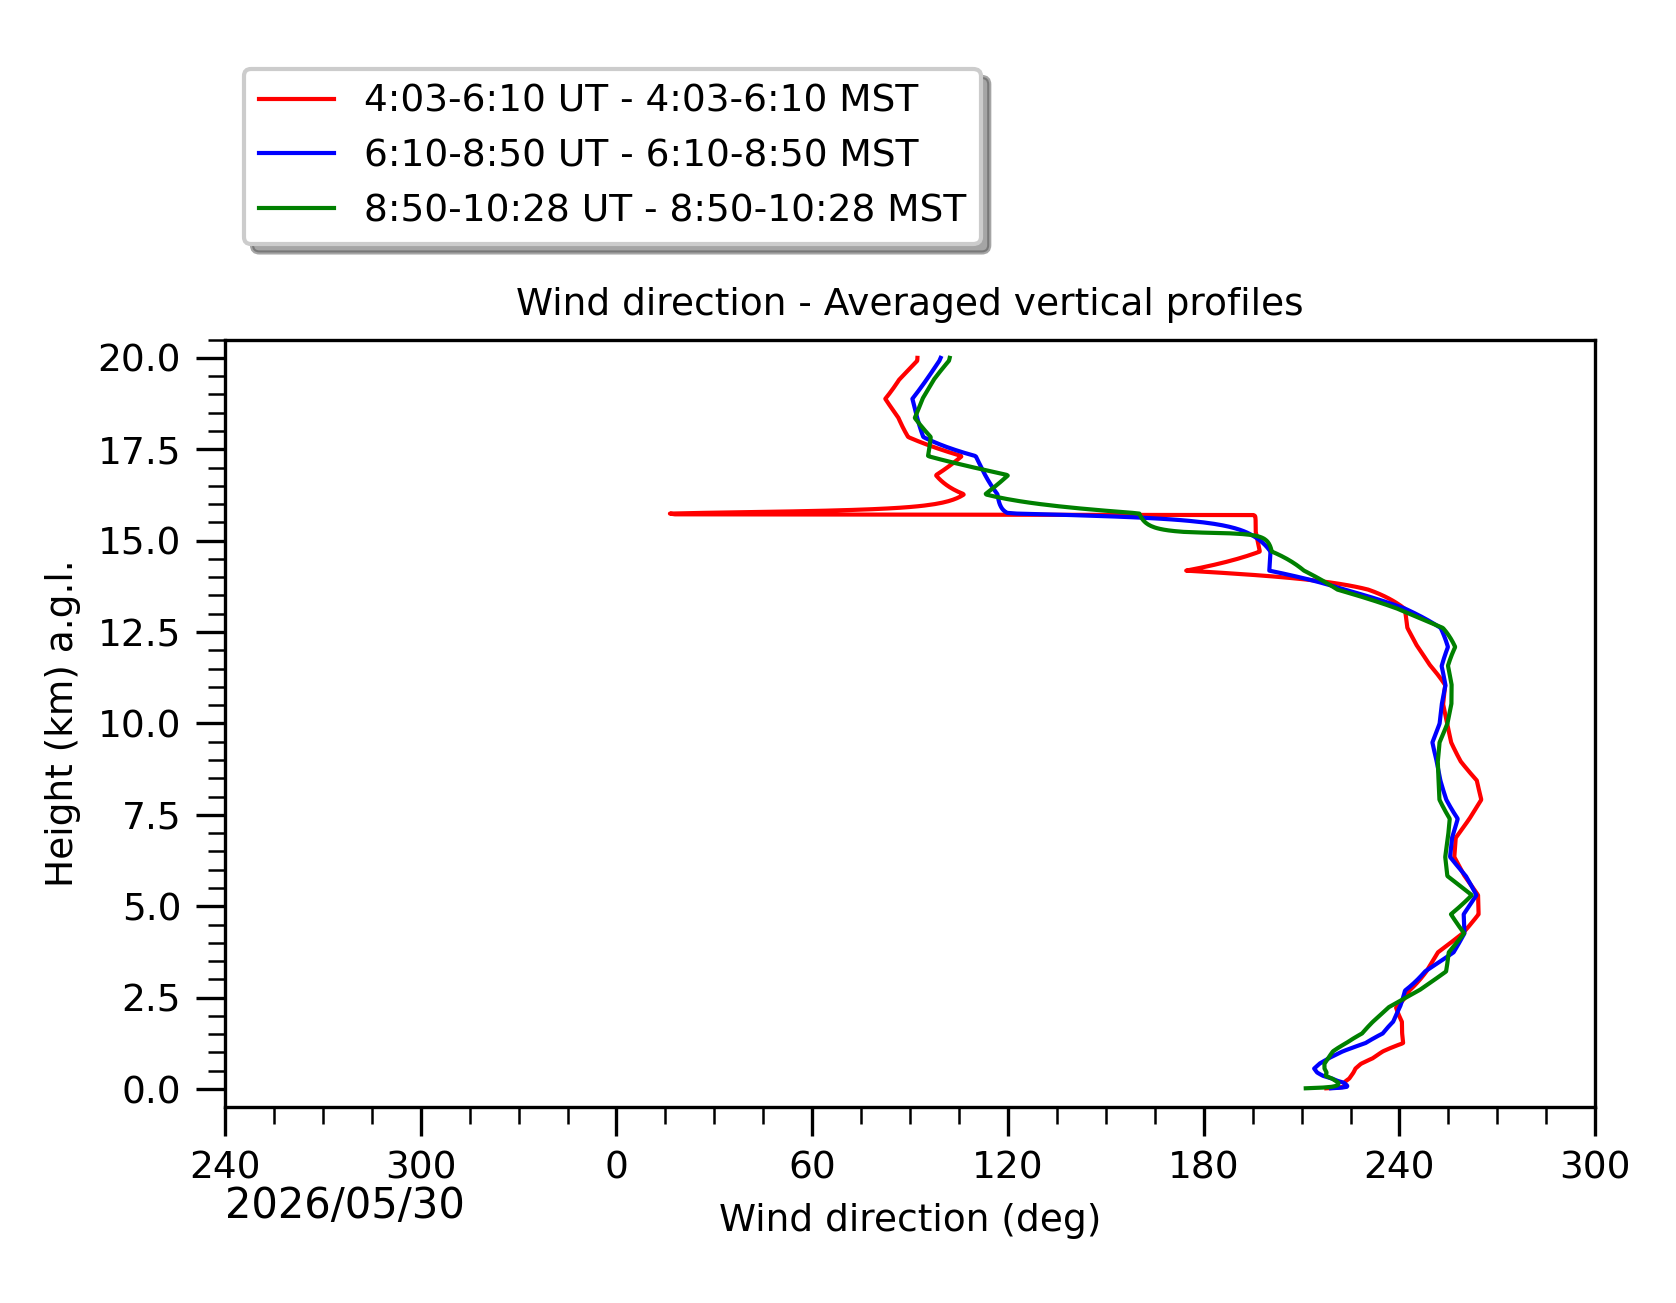
Fig.8 and 9 represent represent the three time averages in the same plot with different colors to better appreciate the macroscopic changes in the three temporal intervals. The x-axis of the wind direction is 360° periodic. The convention is 0°: wind blowing from the North; 90°: wind blowing from the East. It may happen that the scale is repeated multiple times if the wind spirals over itself. The y-axis is the height above ground level (a.g.l.).

|

|
|
Fig. 2: Average wind speed in the "first part of the night". |
Fig. 3: Average wind direction in the "first part of the night". |

|

|
|
Fig. 4: Average wind speed in the "central part of the night". |
Fig. 5: Average wind direction in the "central part of the night". |

|

|
|
Fig. 6: Average wind speed in the "last part of the night". |
Fig. 7: Average wind direction in the "last part of the night". |

|
|
|
Fig. 8: Averaged wind speed in the three successive periods of the night (see red, blue and green intervals). |
Fig. 9: Averaged wind direction in the three successive periods of the night (see red, blue and green intervals). |