Wind Vertical Profiles
Vertical profiles are computed in the [0-20km] range above ground level (a.g.l.) and centered on the LBT. Data points frequency is 2 minutes. Here are shown:
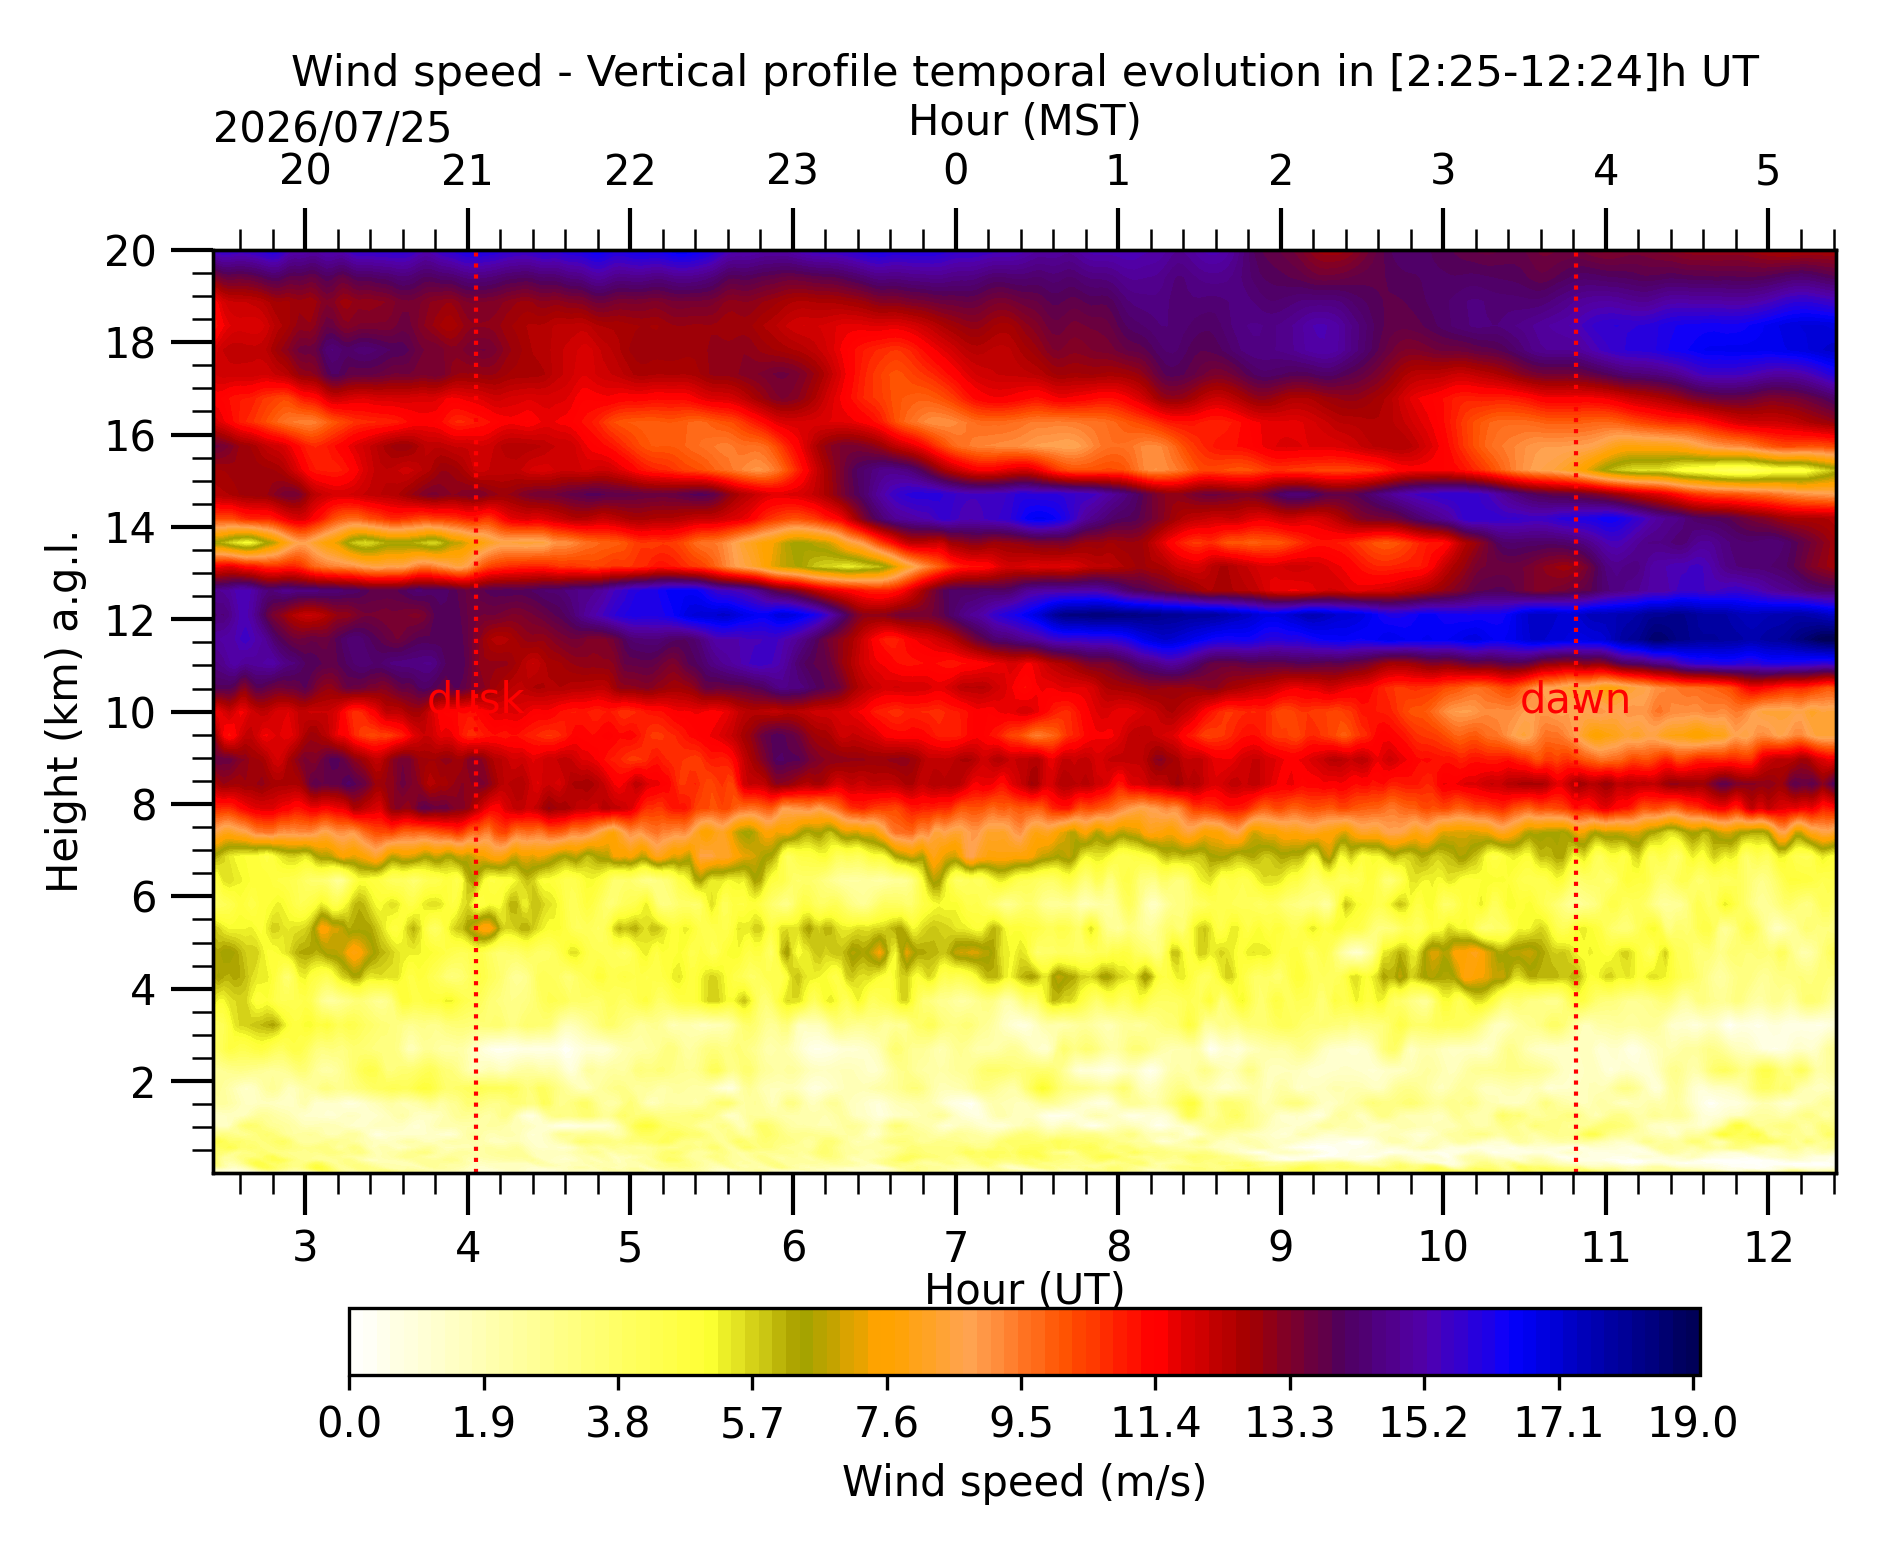
Forecast relative to the night starting on 2026/07/25
TEMPORAL EVOLUTION:
TIME AVERAGES:
Three time averages are presented, computed in the first, central and last part of the night (see partition). The corresponding MST (MST=UT-7) is shown on the top of the figure. The blue light halo around each average represents the +/- sigma in the respective time window. Fig.8 and 9 represent represent the three time averages in the same plot with different colors to better appreciate the macroscopic changes in the three temporal intervals. The x-axis of the wind direction is 360° periodic. The convention is 0°: wind blowing from the North; 90°: wind blowing from the East. It may happen that the scale is repeated multiple times if the wind spirals over itself. The y-axis is the height above ground level (a.g.l.).
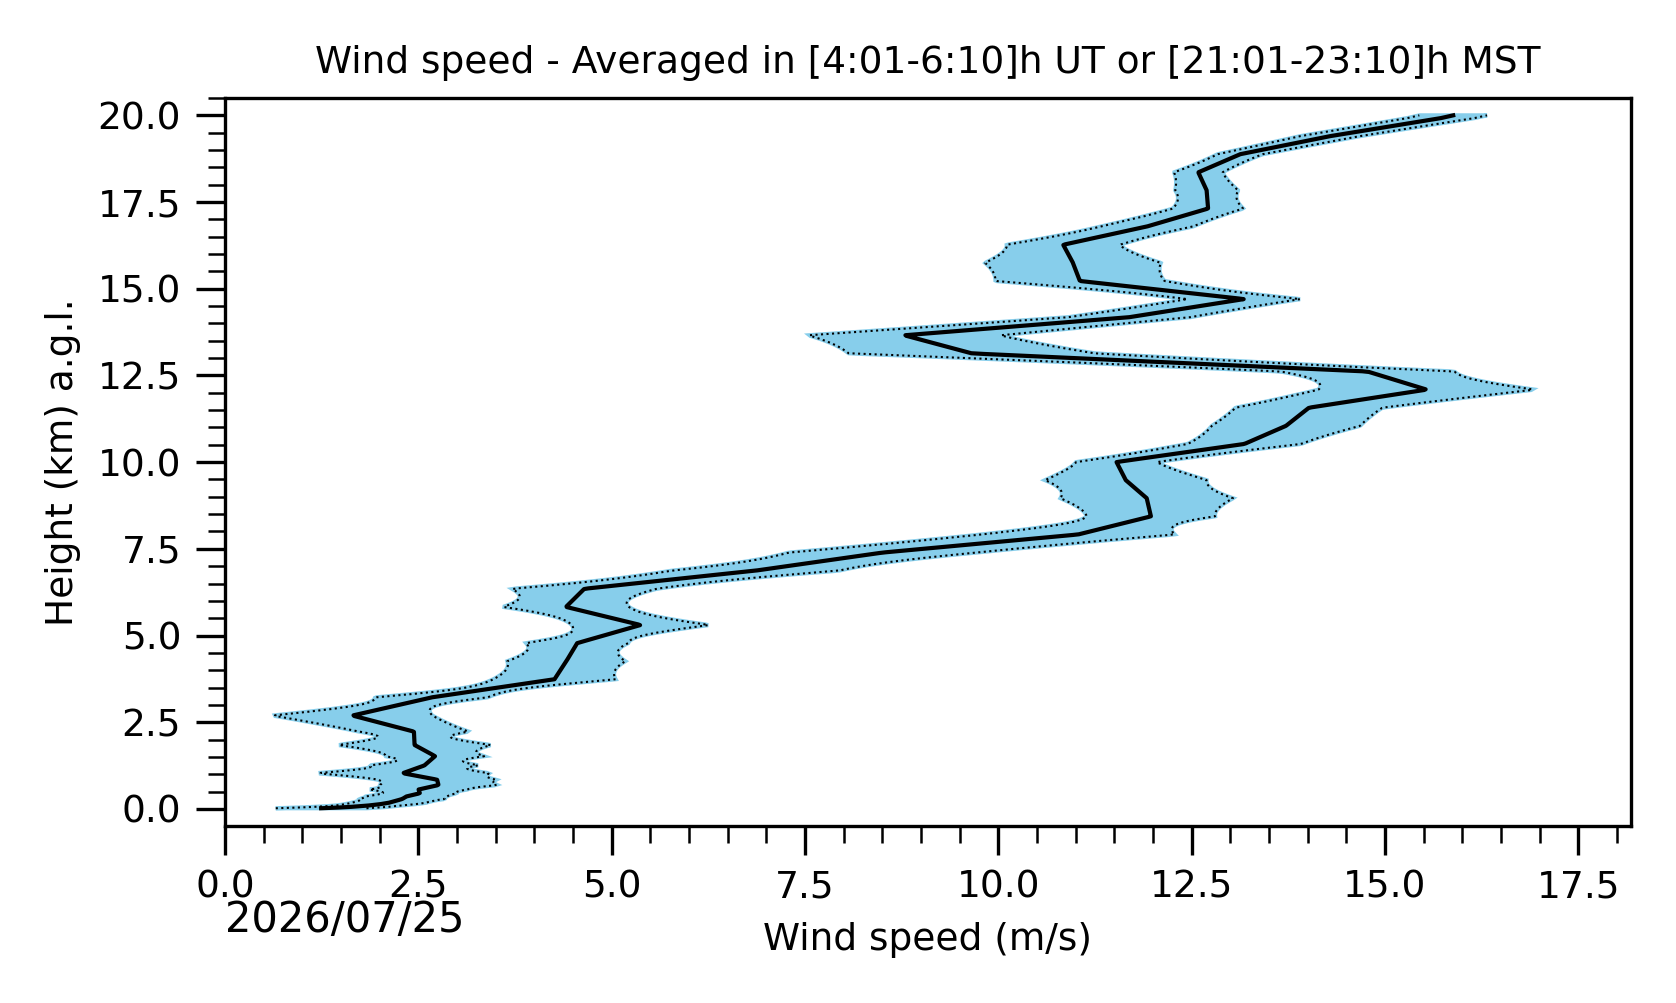
Fig. 2: Average wind speed in the “first part of the night”.
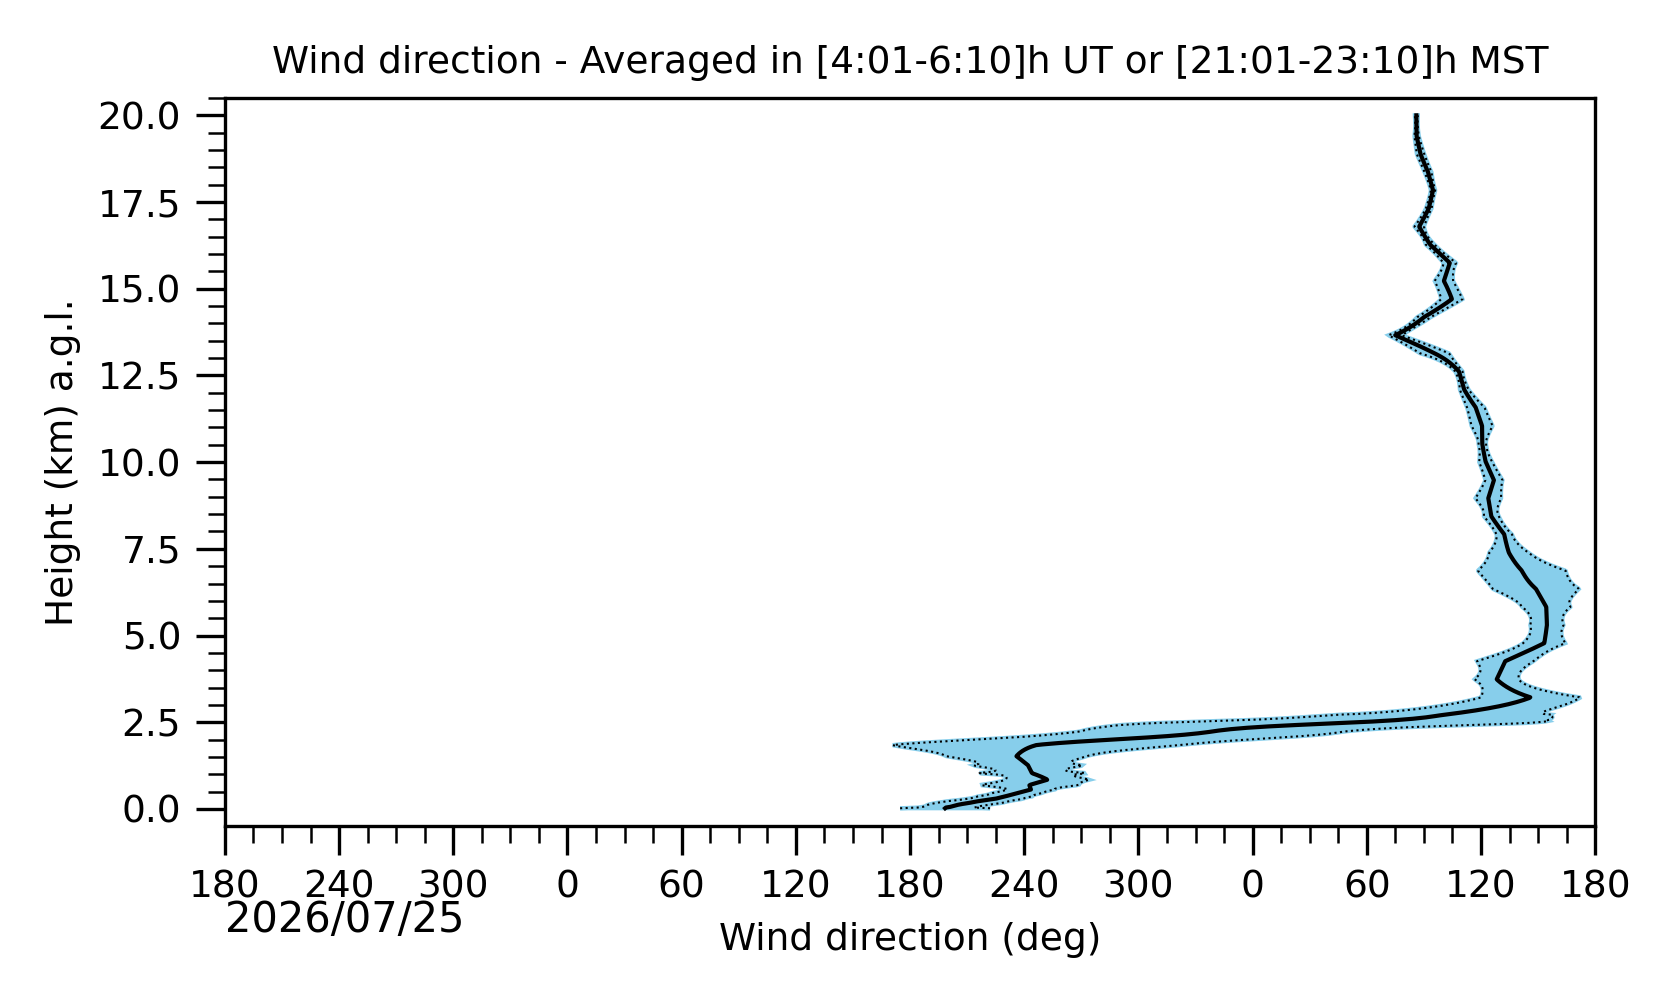
Fig. 3: Average wind direction in the “first part of the night”.
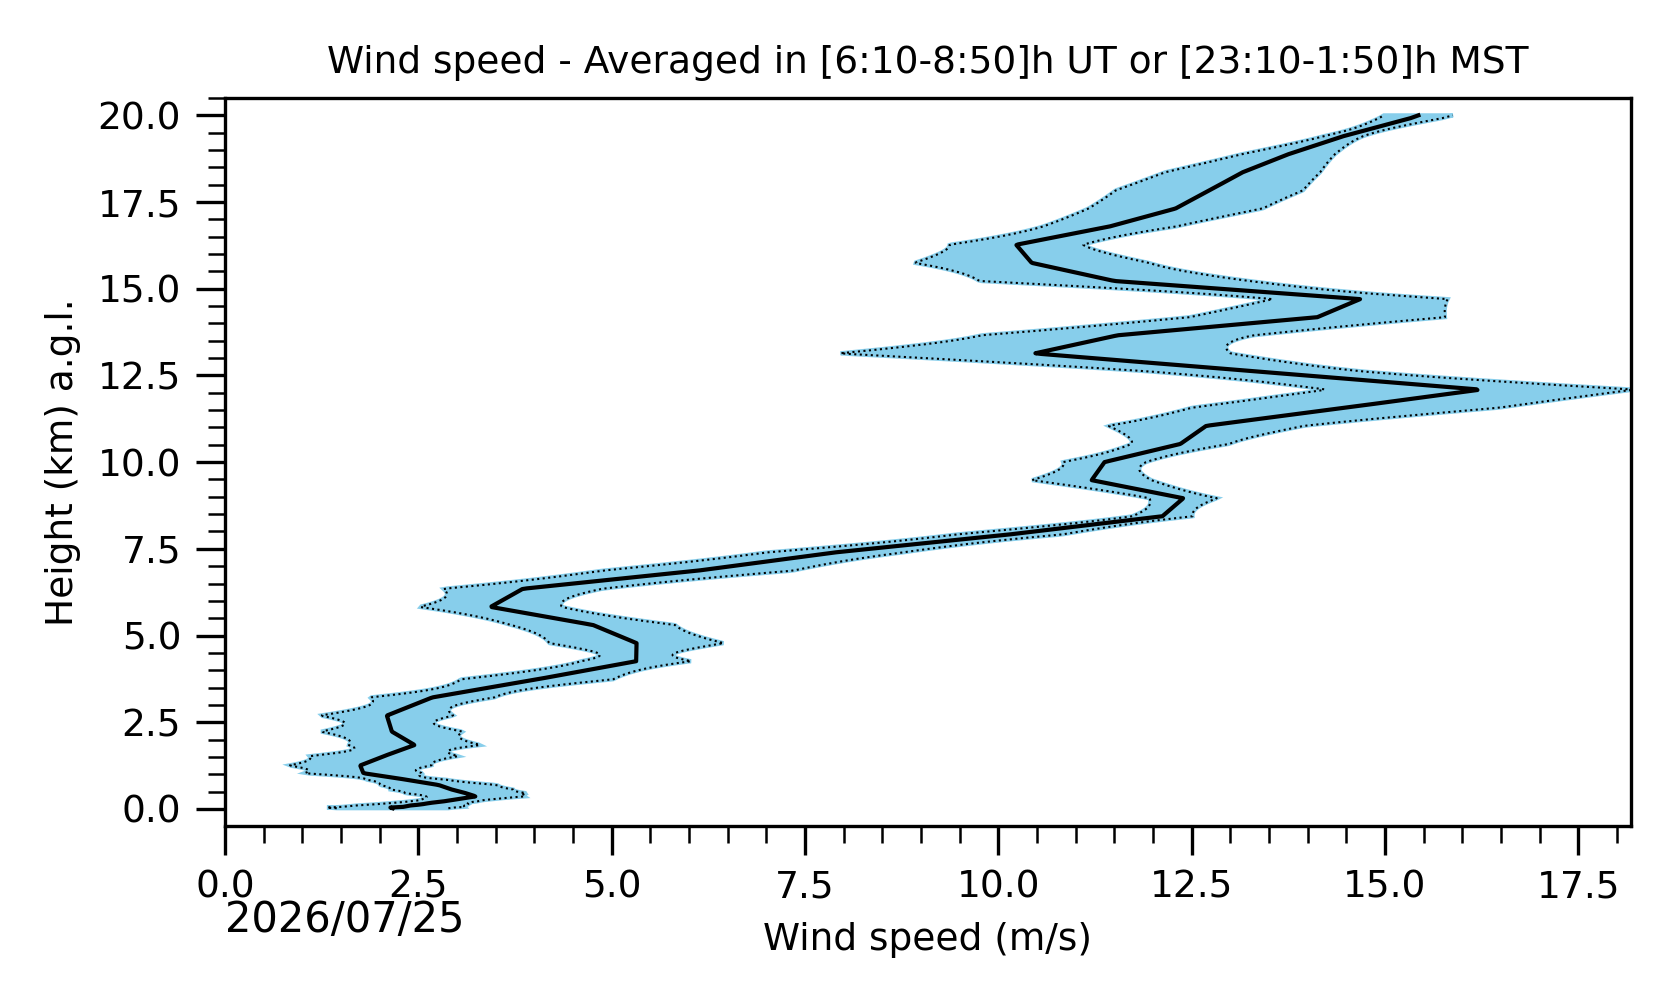
Fig. 4: Average wind speed in the “central part of the night”.
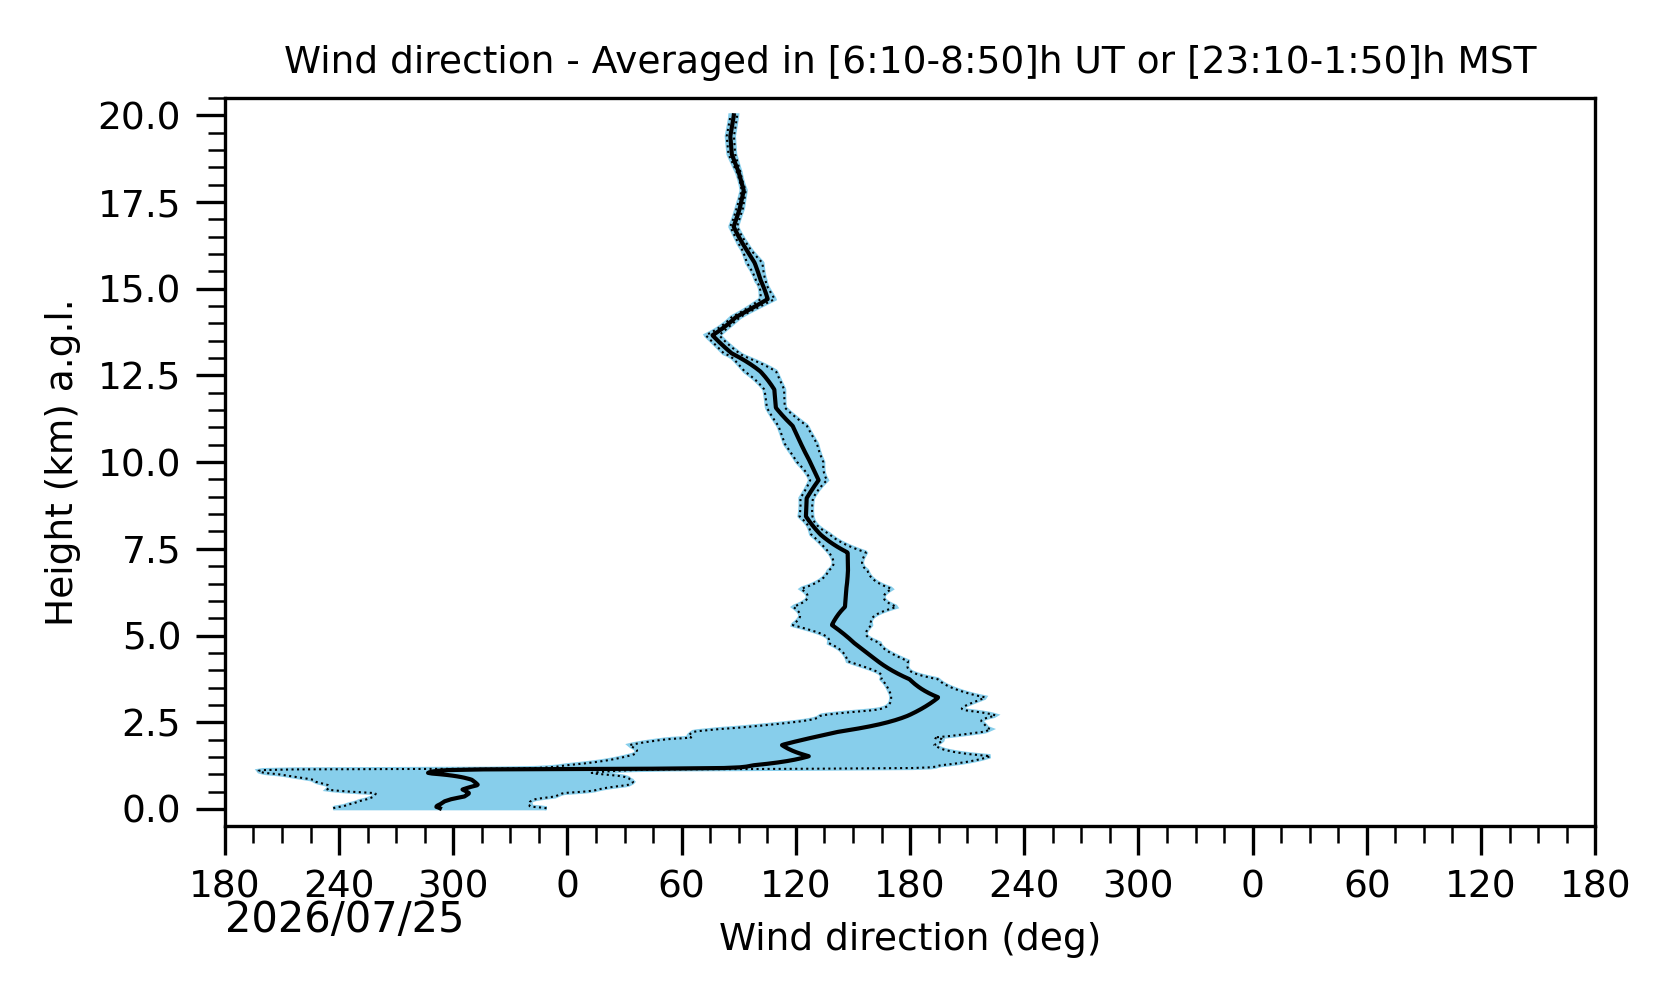
Fig. 5: Average wind direction in the “central part of the night”.
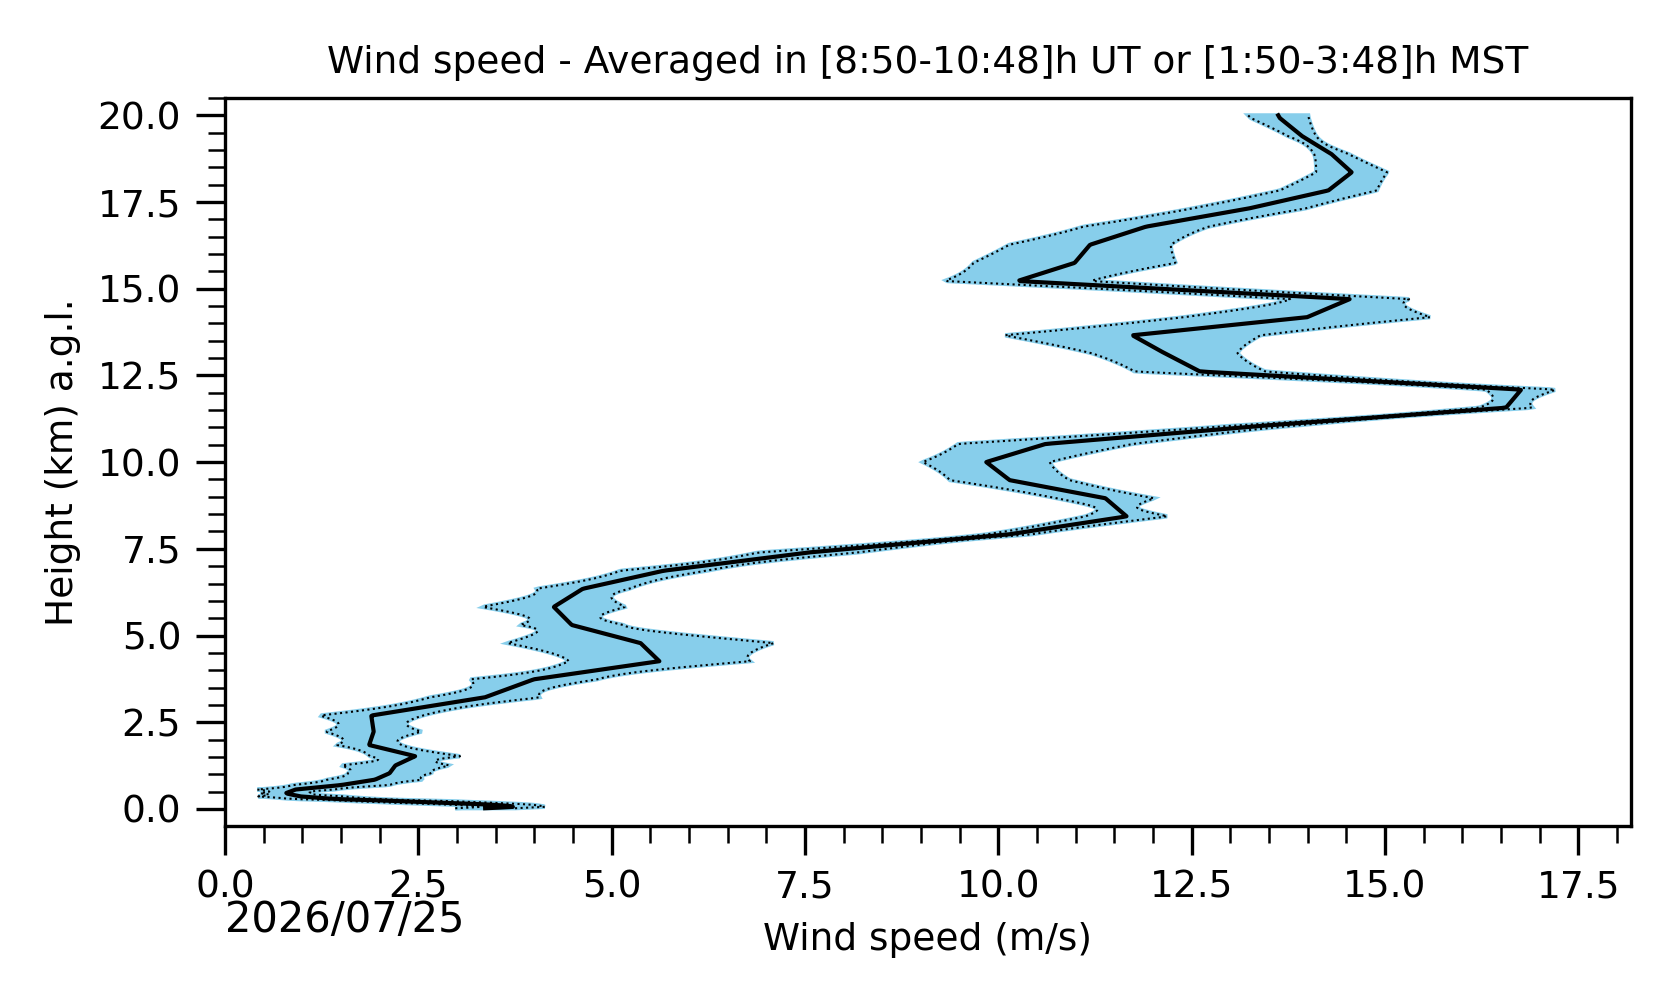
Fig. 6: Average wind speed in the “last part of the night”.
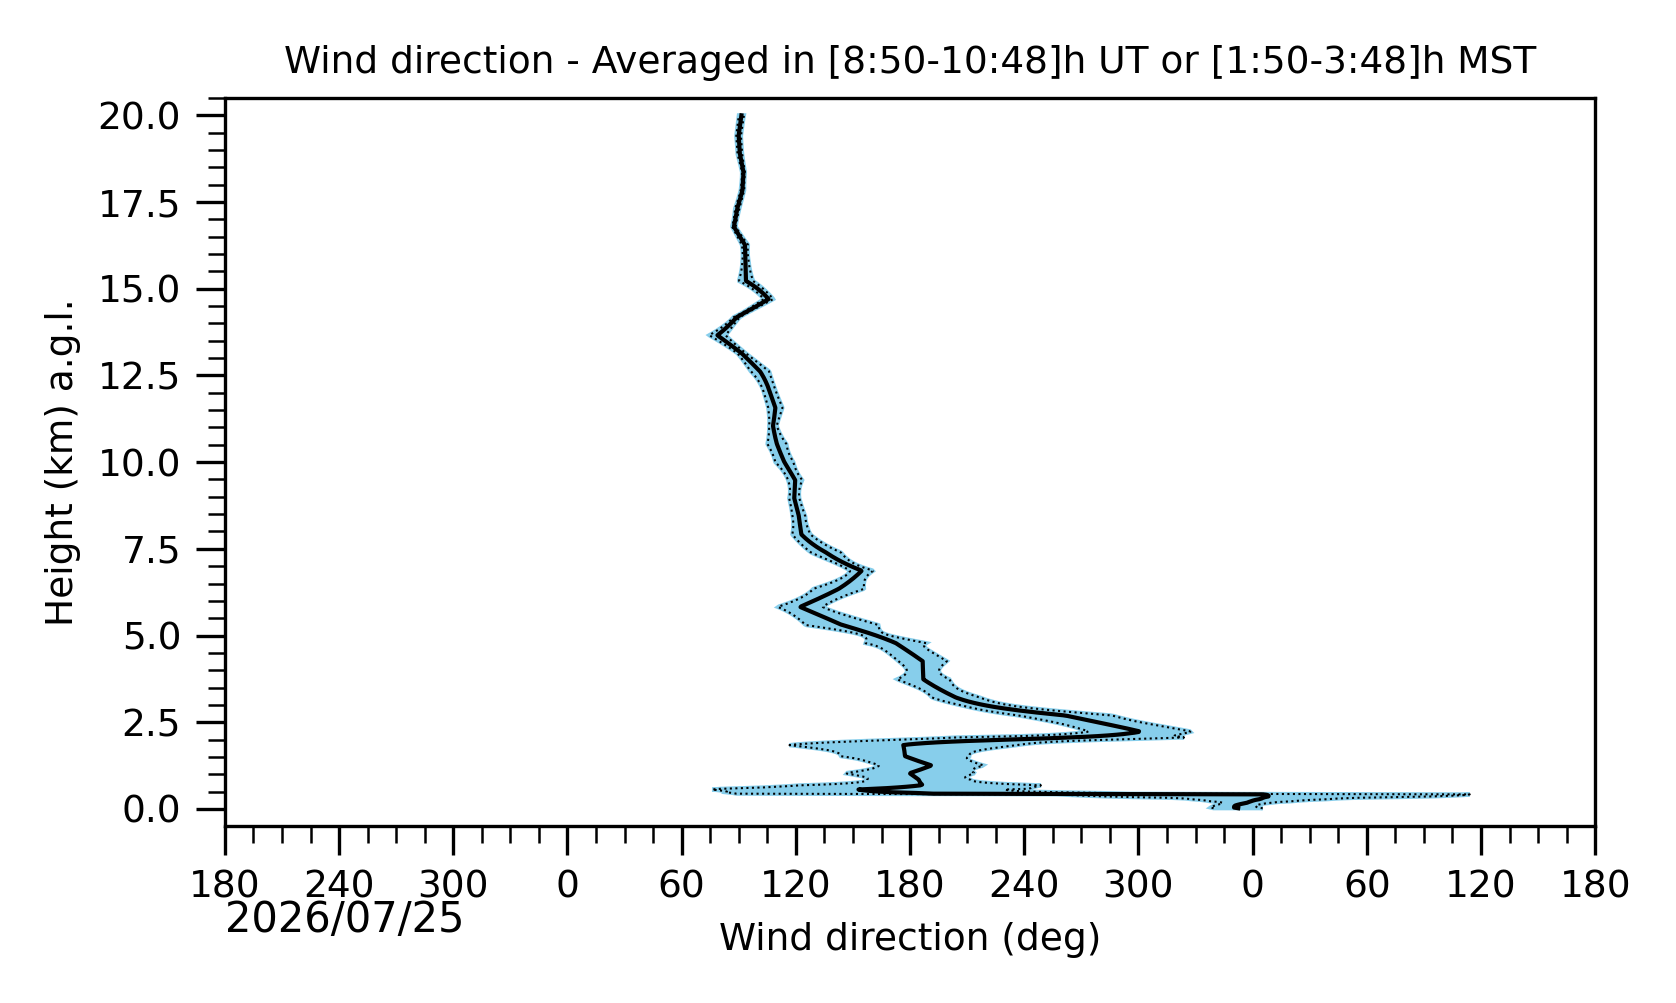
Fig. 7: Average wind direction in the “last part of the night”.
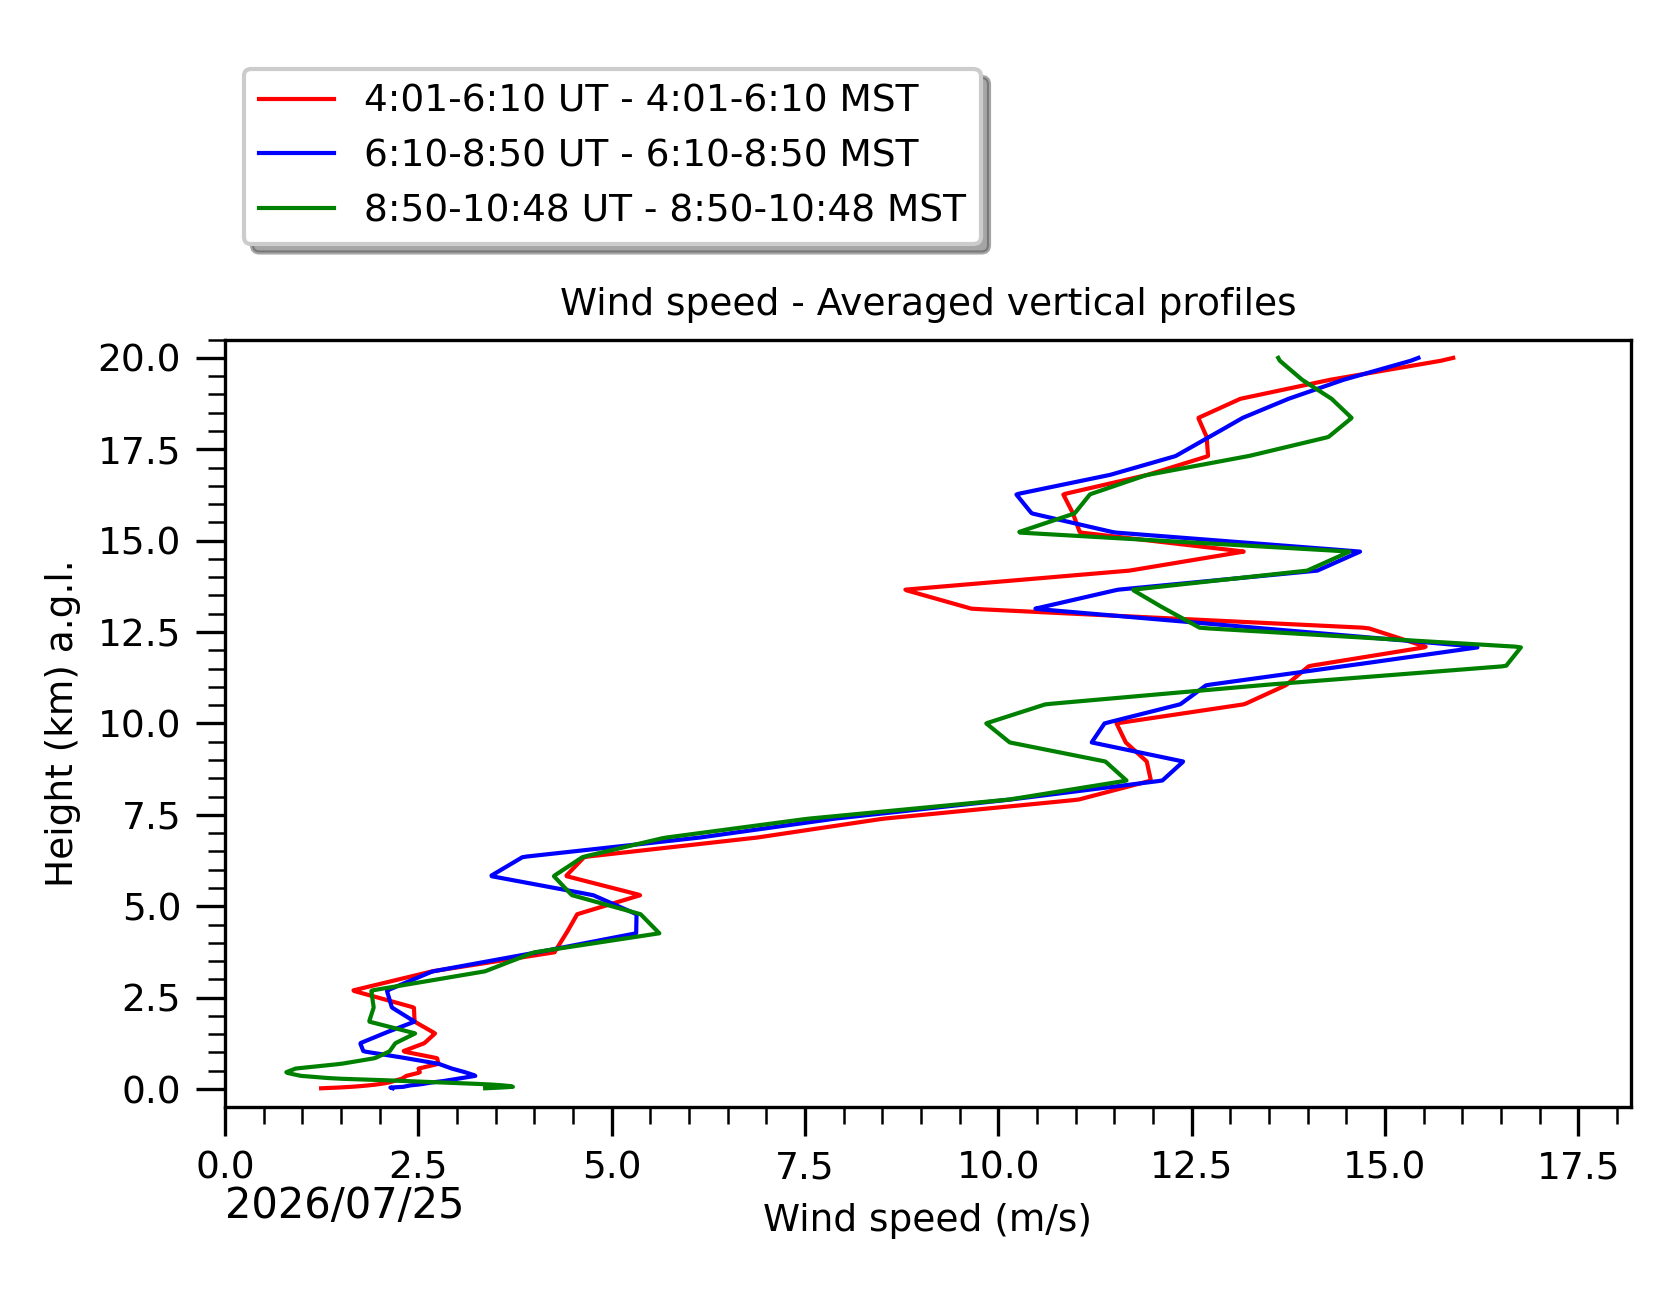
Fig. 8: Averaged wind speed in the three successive periods of the night (see red, blue and green intervals).
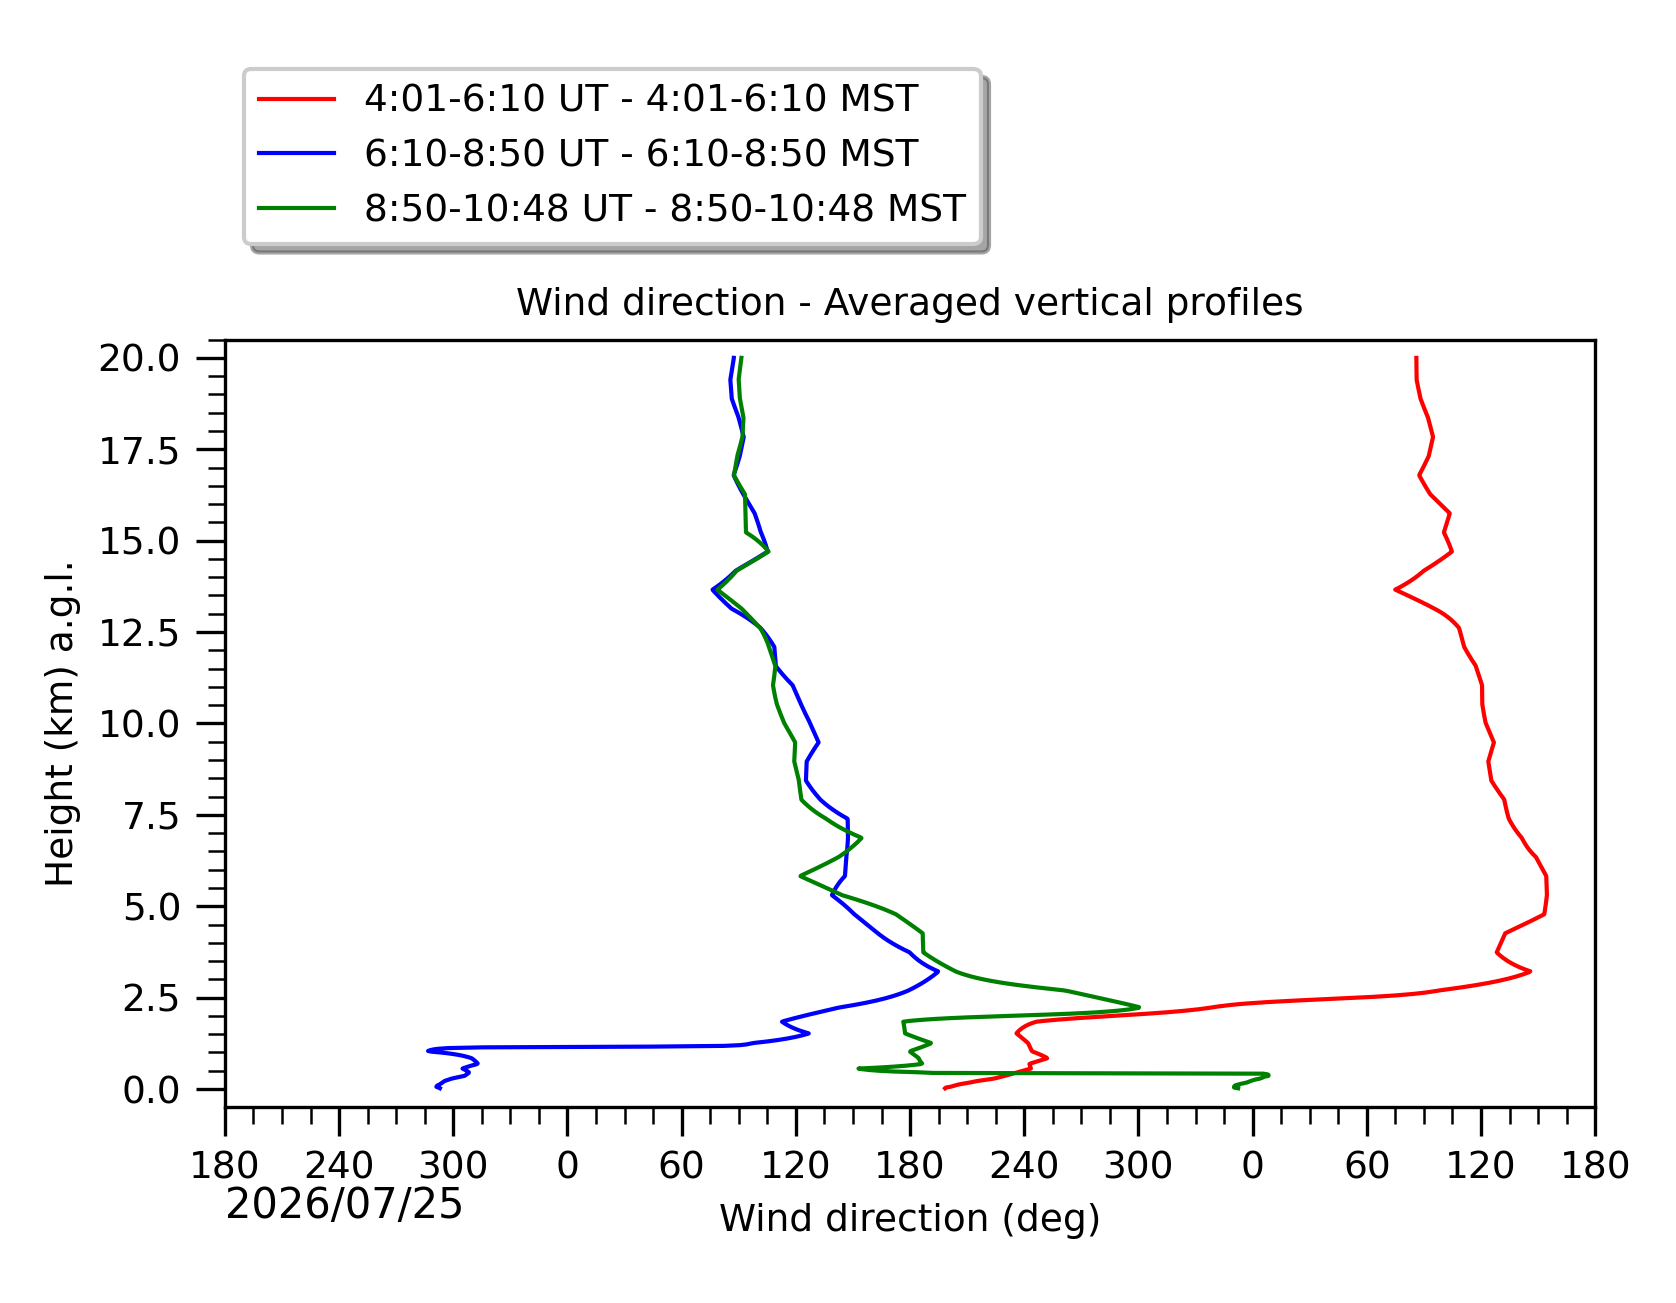
Fig. 9: Averaged wind direction in the three successive periods of the night (see red, blue and green intervals).