CN2 Vertical Profiles
Forecast relative to the night starting on 2026/07/26 MST
Note: click on a figure to magnify the image. Date of figures refers to the start of night in MST.
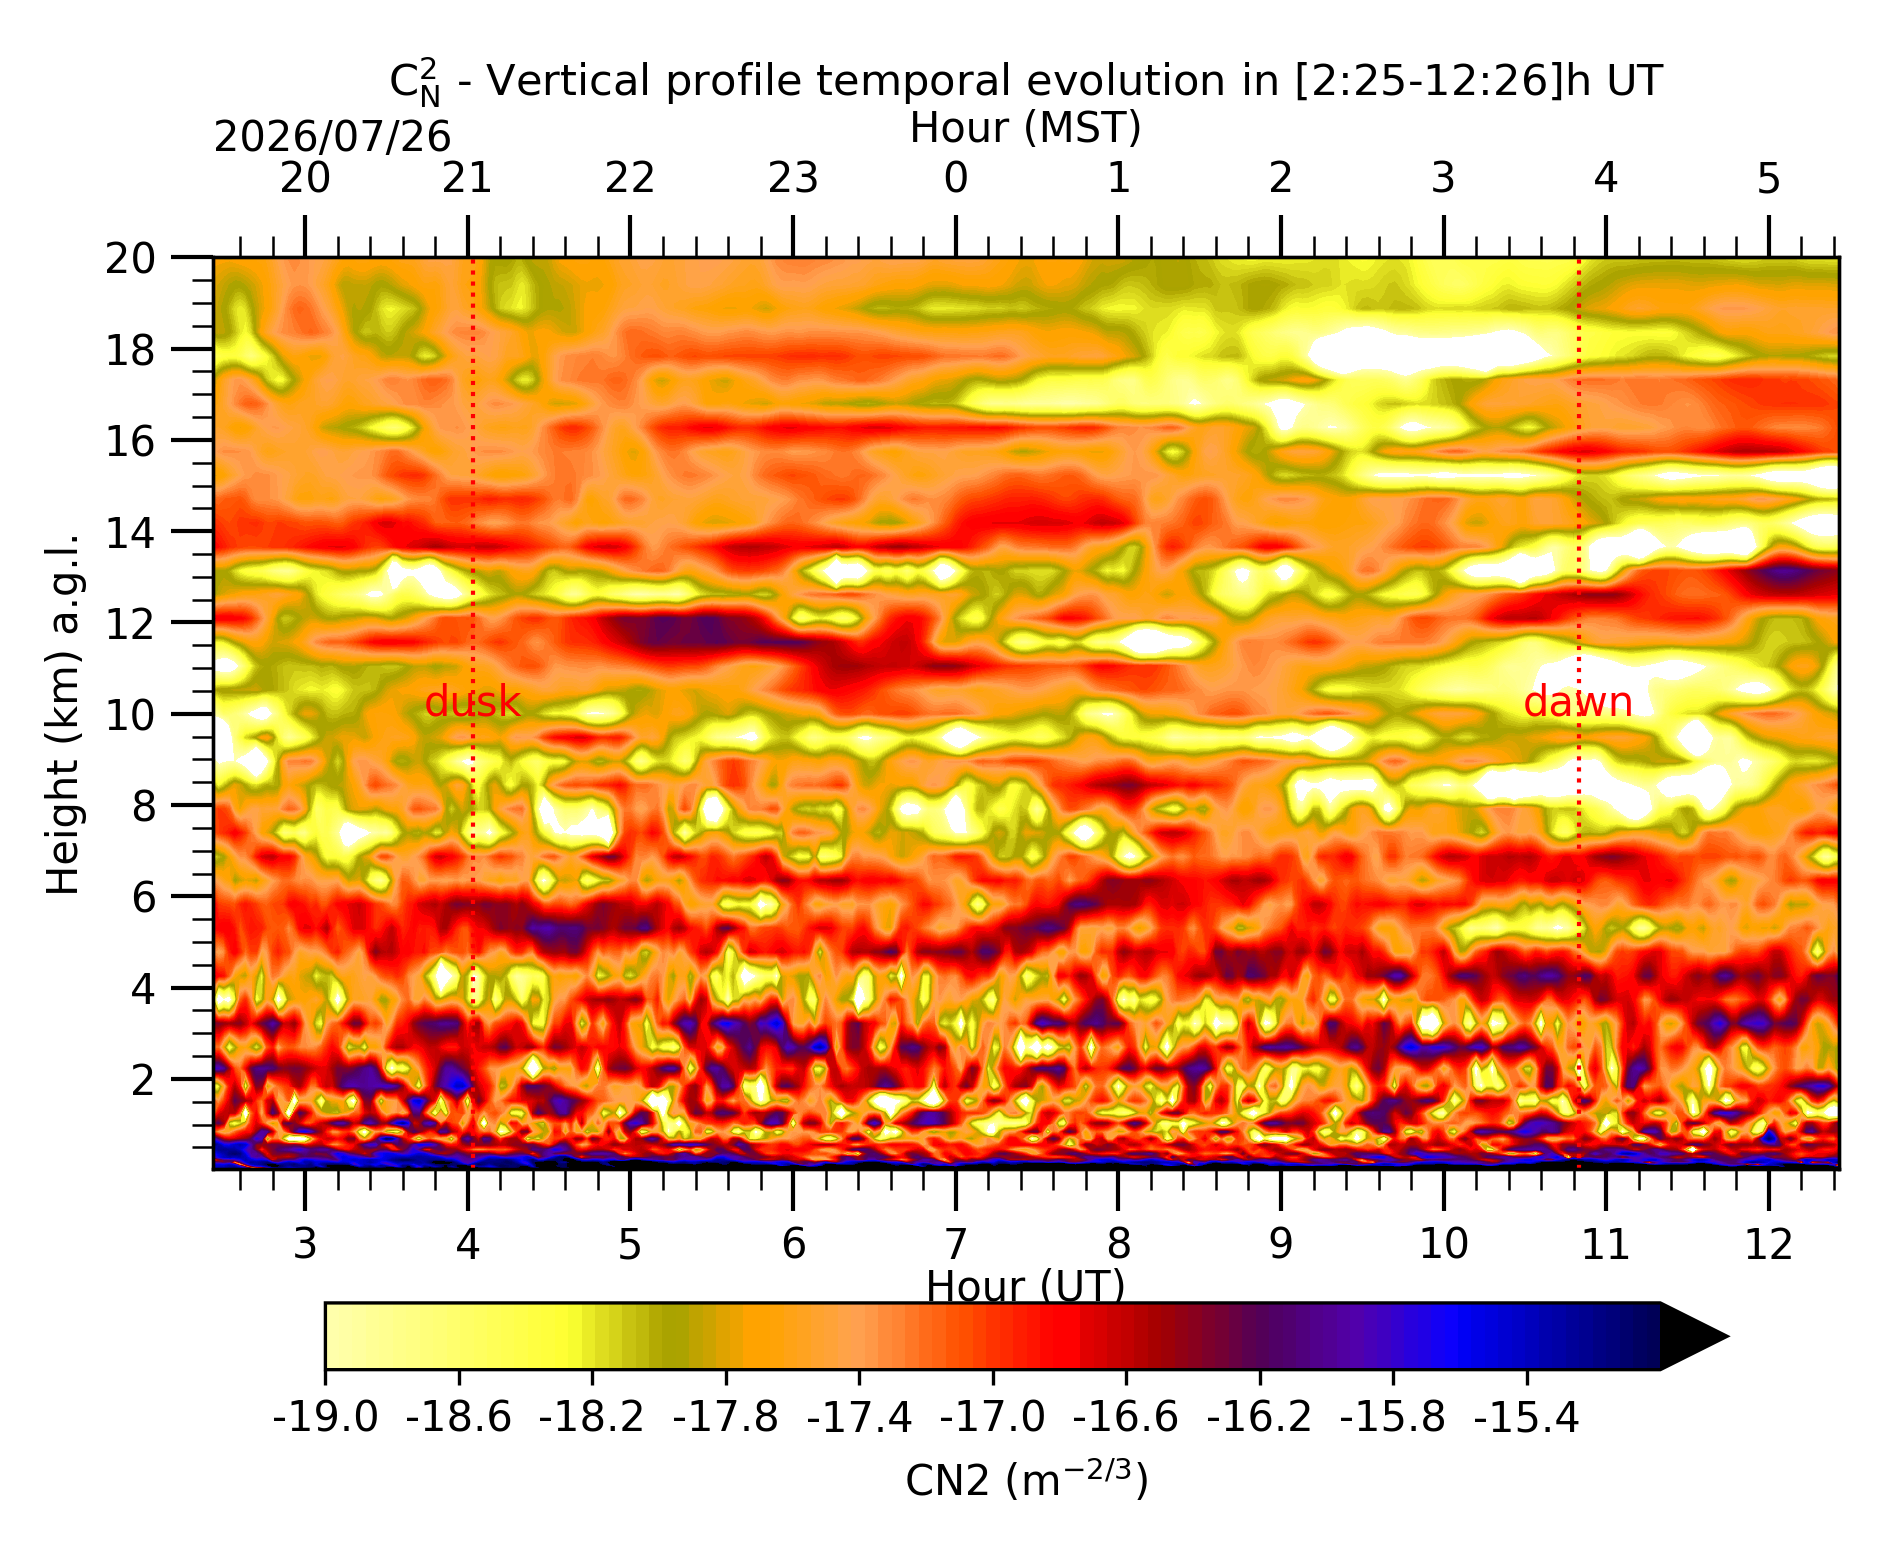
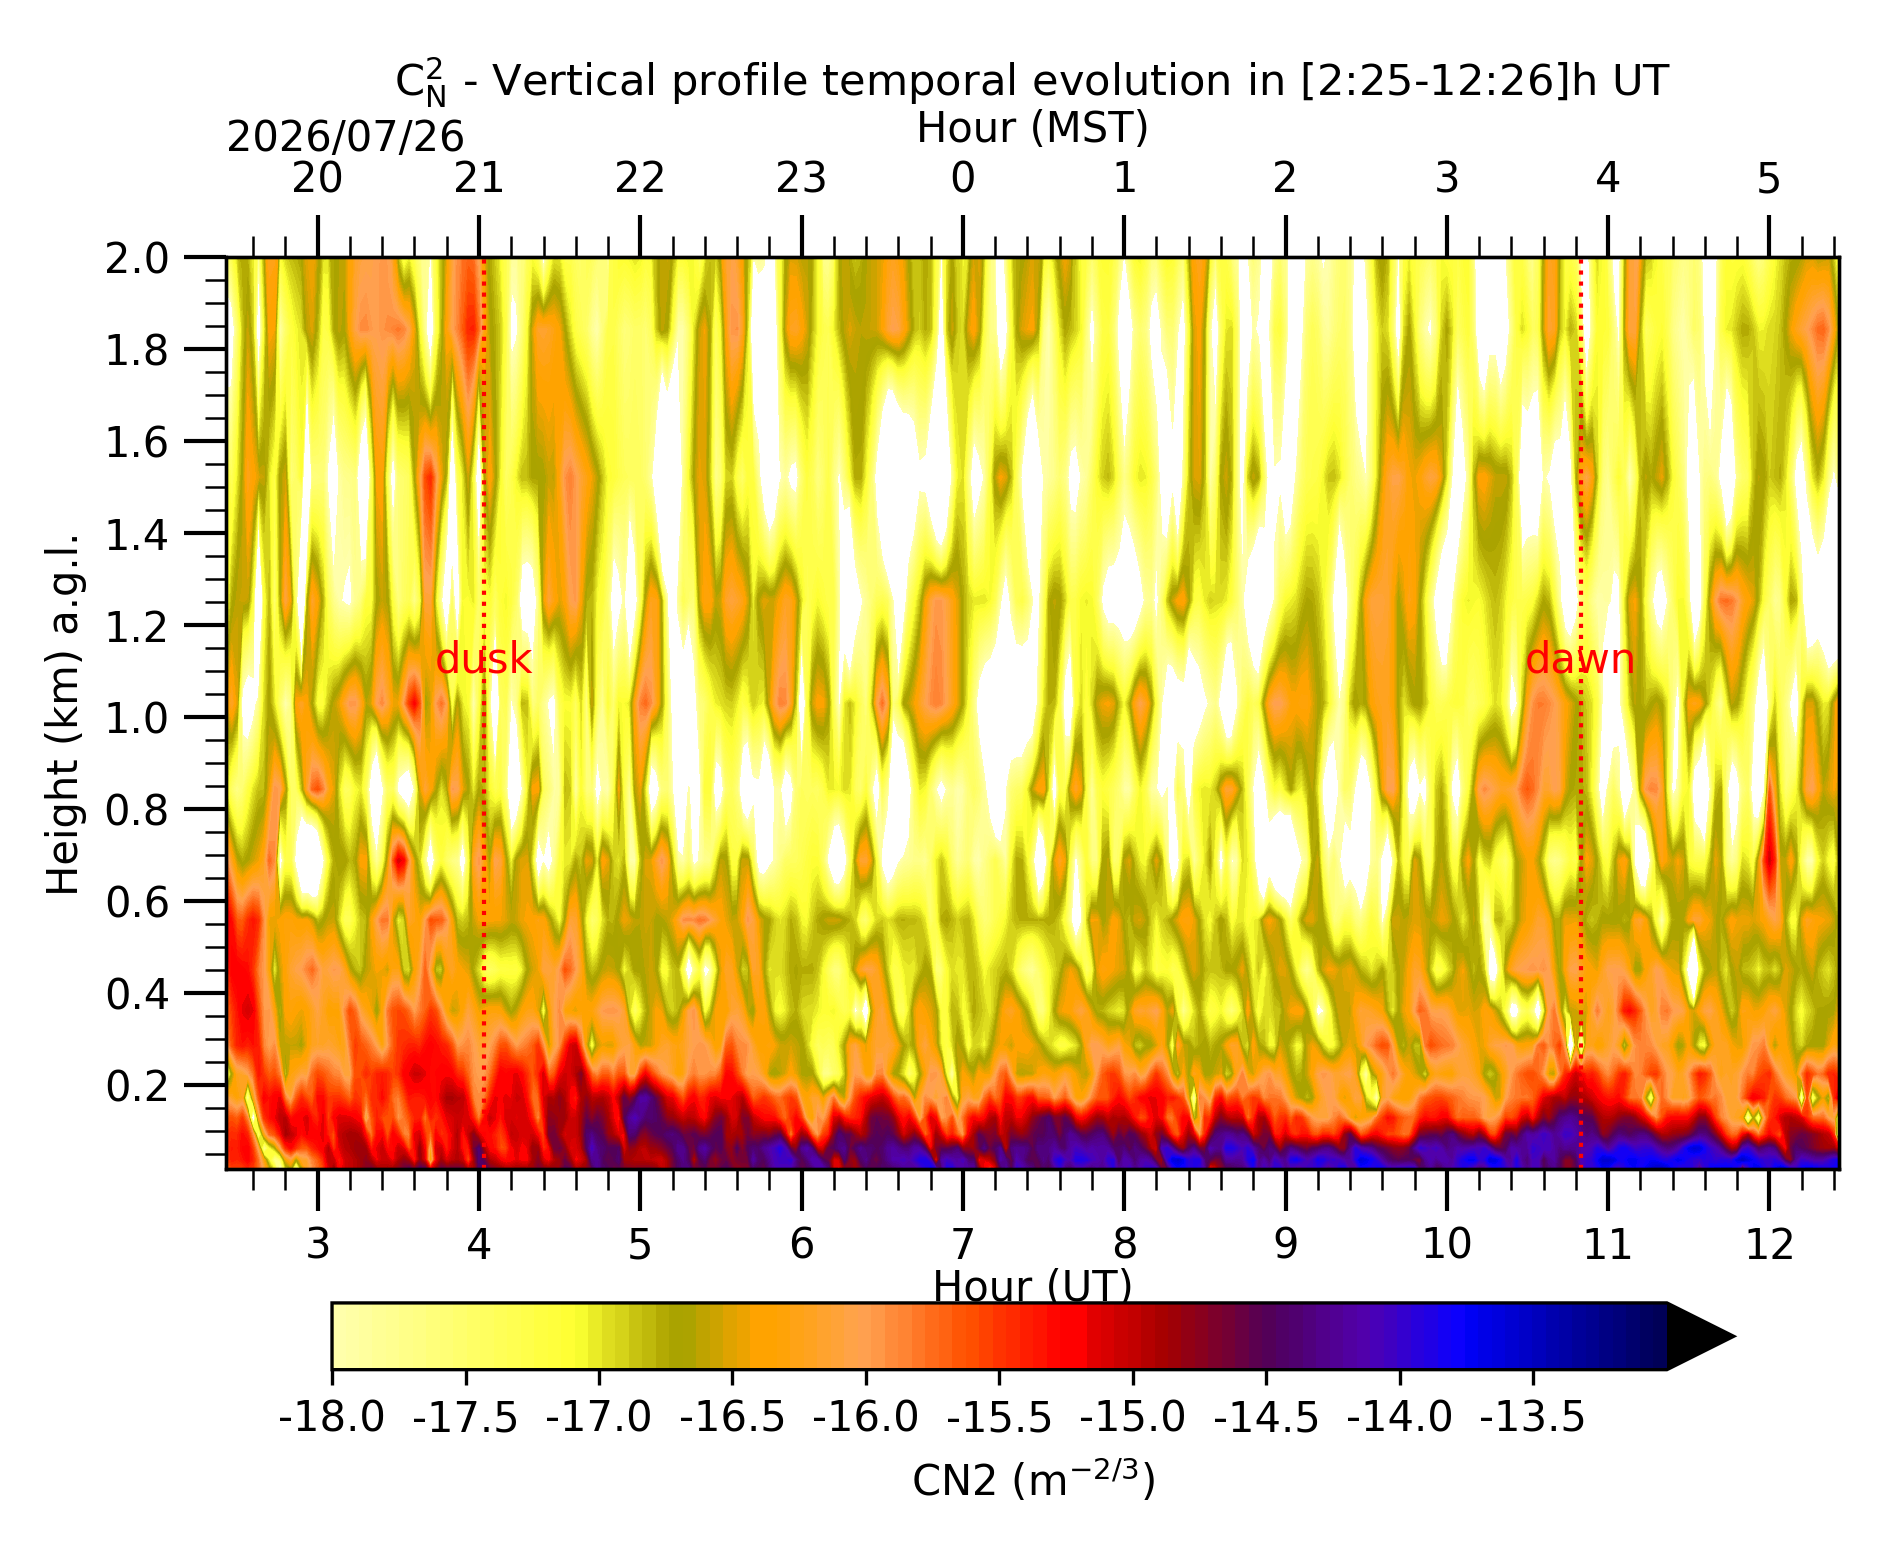
Vertical profiles are computed in the [0-20]km range abobe ground level (a.g.l.) and centered on the LBT. Data points temporal frequency is 2 minutes. Here are shown:
TIME AVERAGES:
Three time averages of the CN2 profiles are presented in Fig. 3 to 5, computed in the first, central and last part of the night (see partition). The corresponding MST (MST=UT-7) is shown on the top of the figure. The blue light halo around each average represents the +/- sigma in the respective time window.
Fig. 6 represents the three time averages of the CN2 profiles in the same plot with different colors to better appreciate the macroscopic changes in the three temporal intervals.
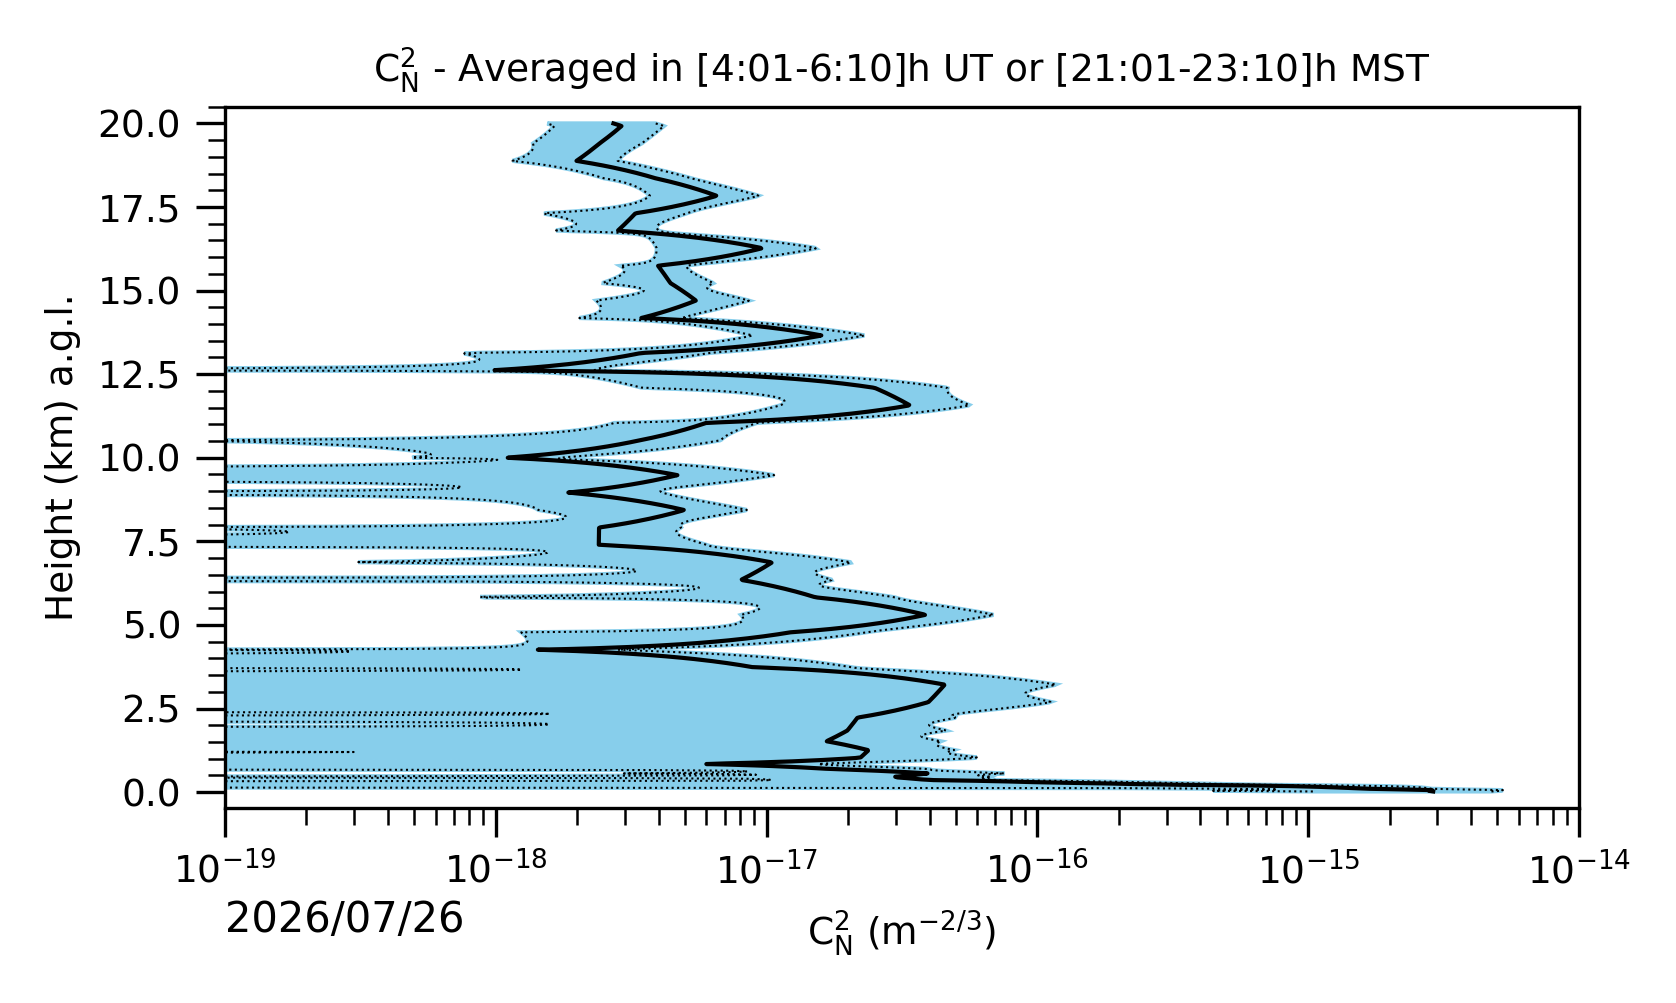
Fig. 3: Average CN2 in the “first part of the night”.
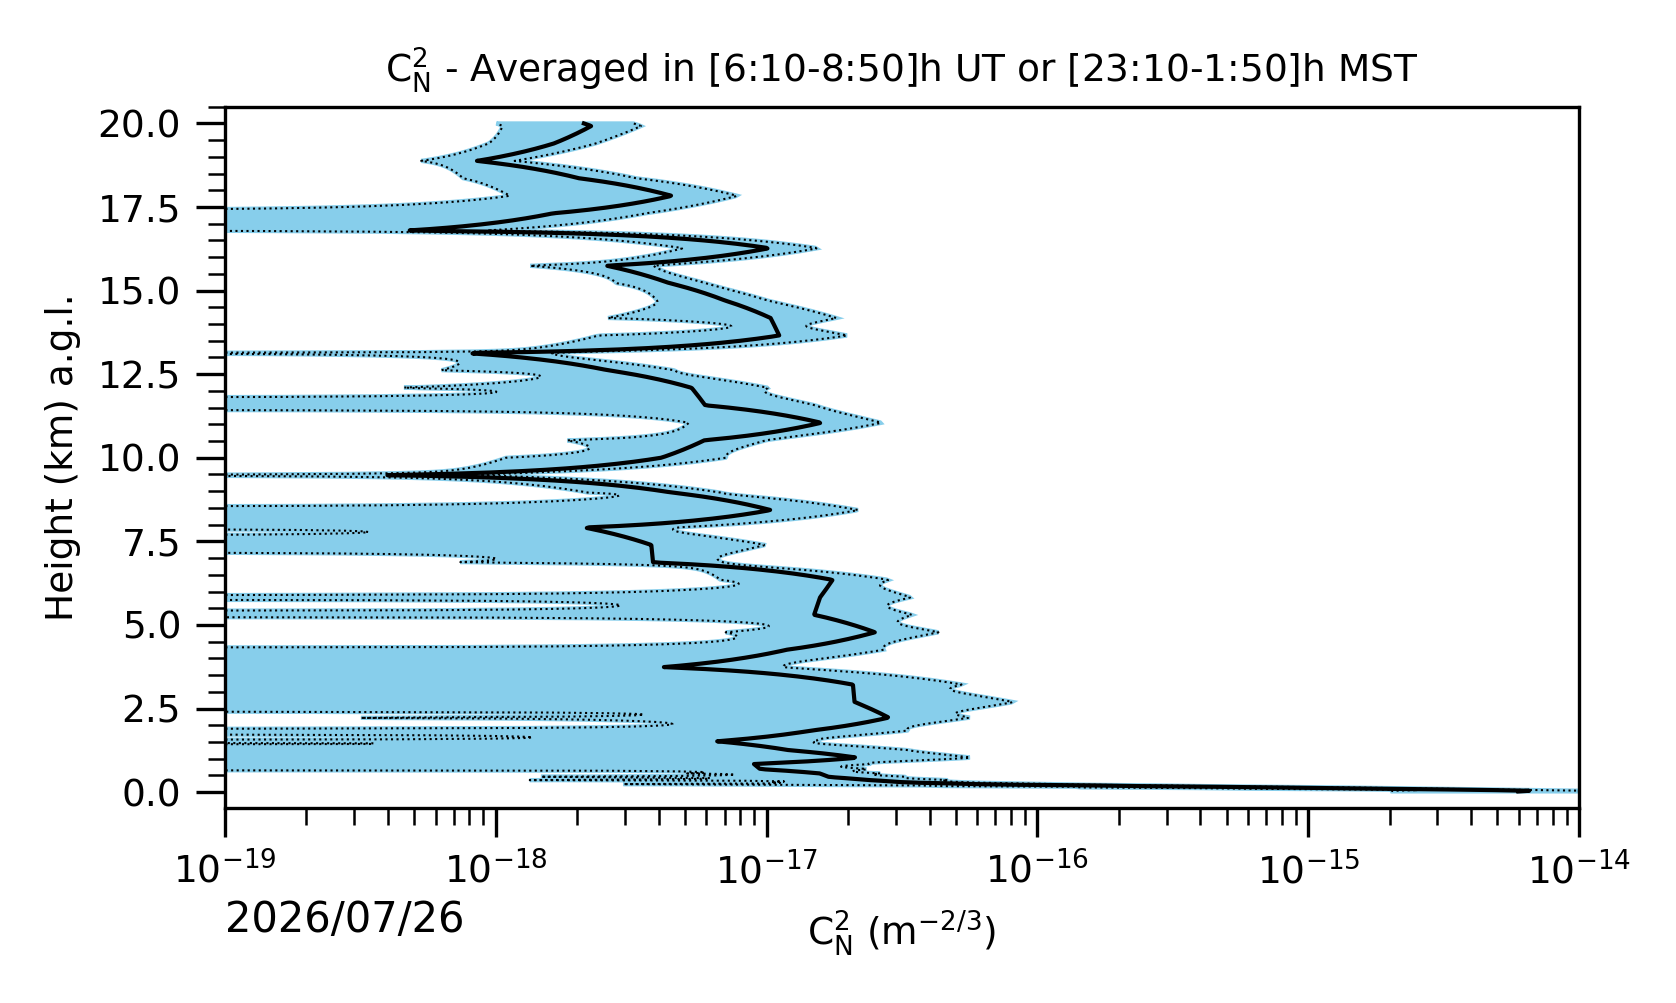
Fig. 4: Average CN2 in the “central part of the night”.
Fig. 5: Average CN2 in the “last part of the night”.
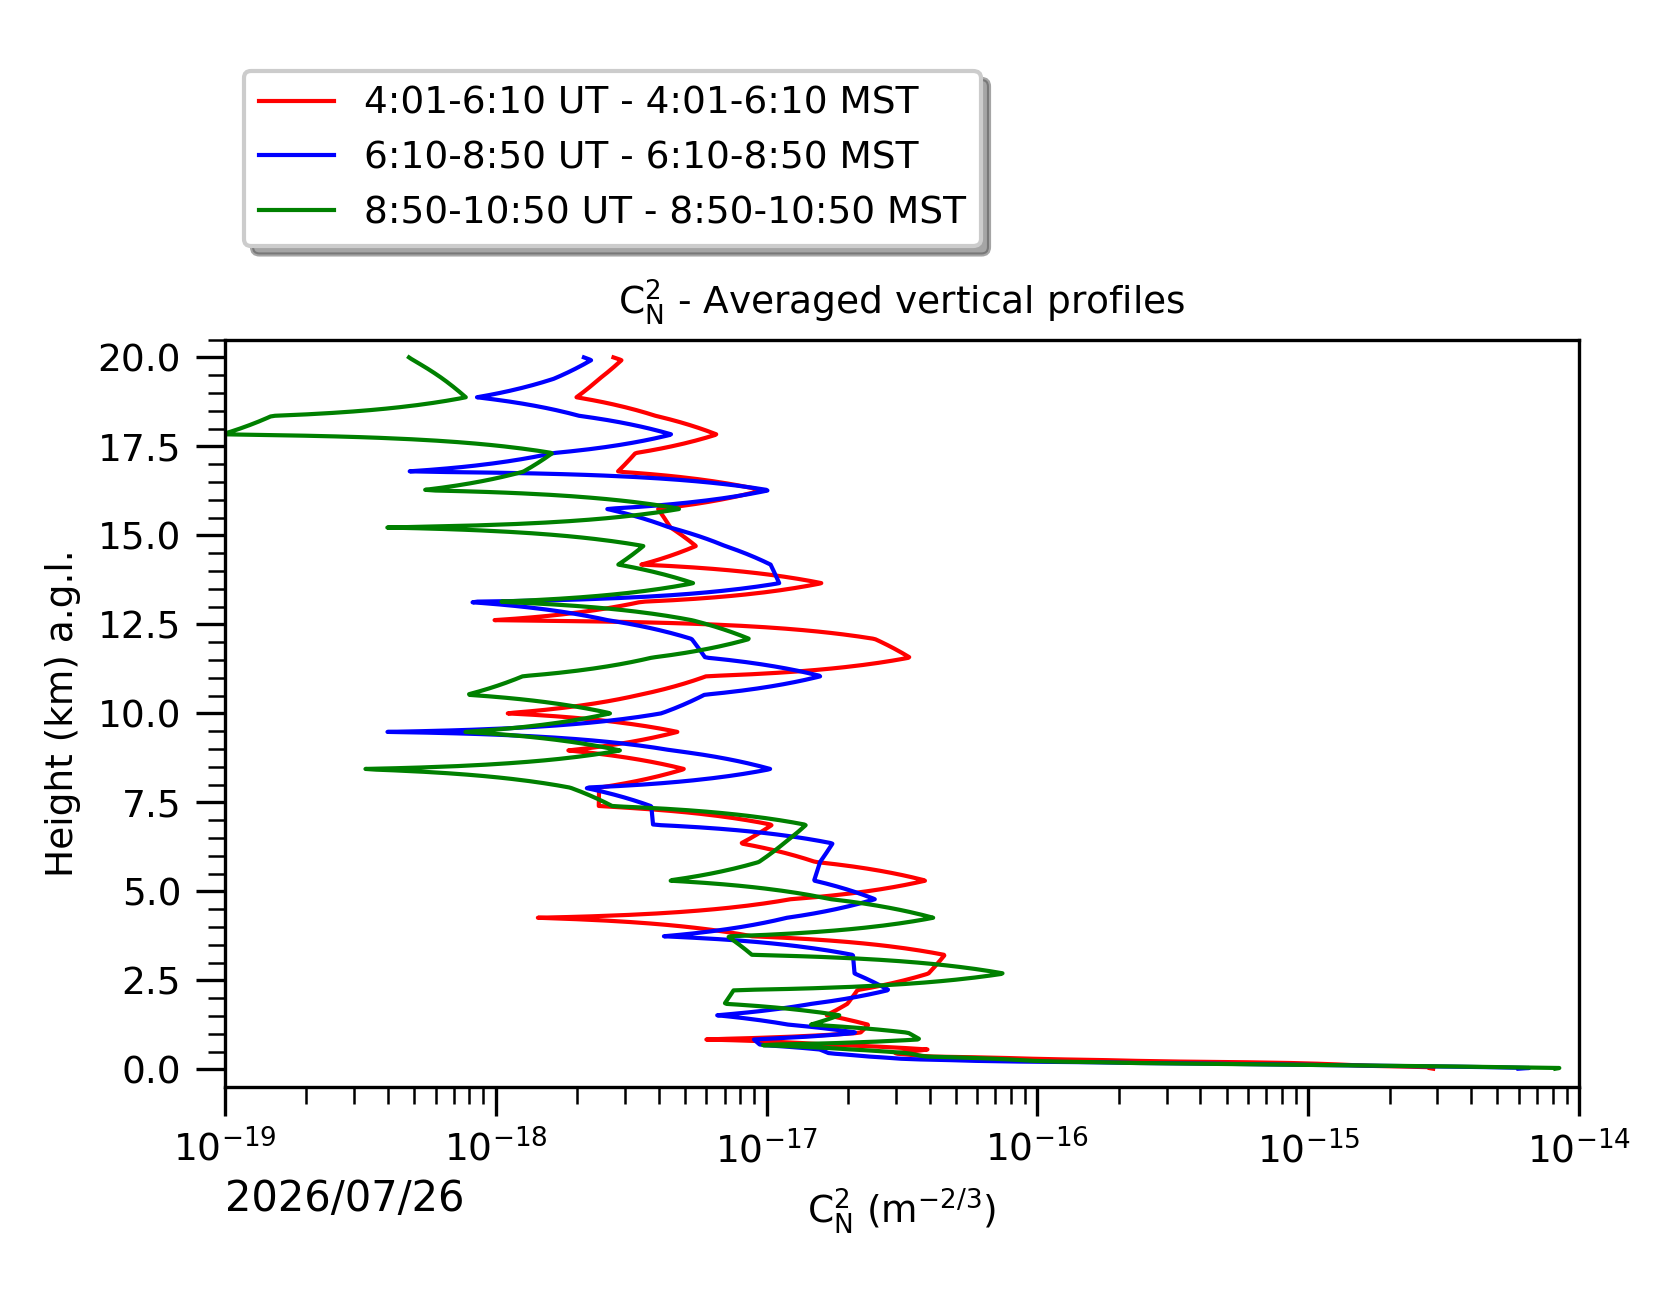
Fig. 6: Averaged CN2 in the three successive periods of the night (see red, blue and green intervals)
Fig. 6: Averaged CN2 in the three successive periods of the night (see red, blue and green intervals)