Climatological analysis at Mt. Graham
DIMM seeing cumulative distributions
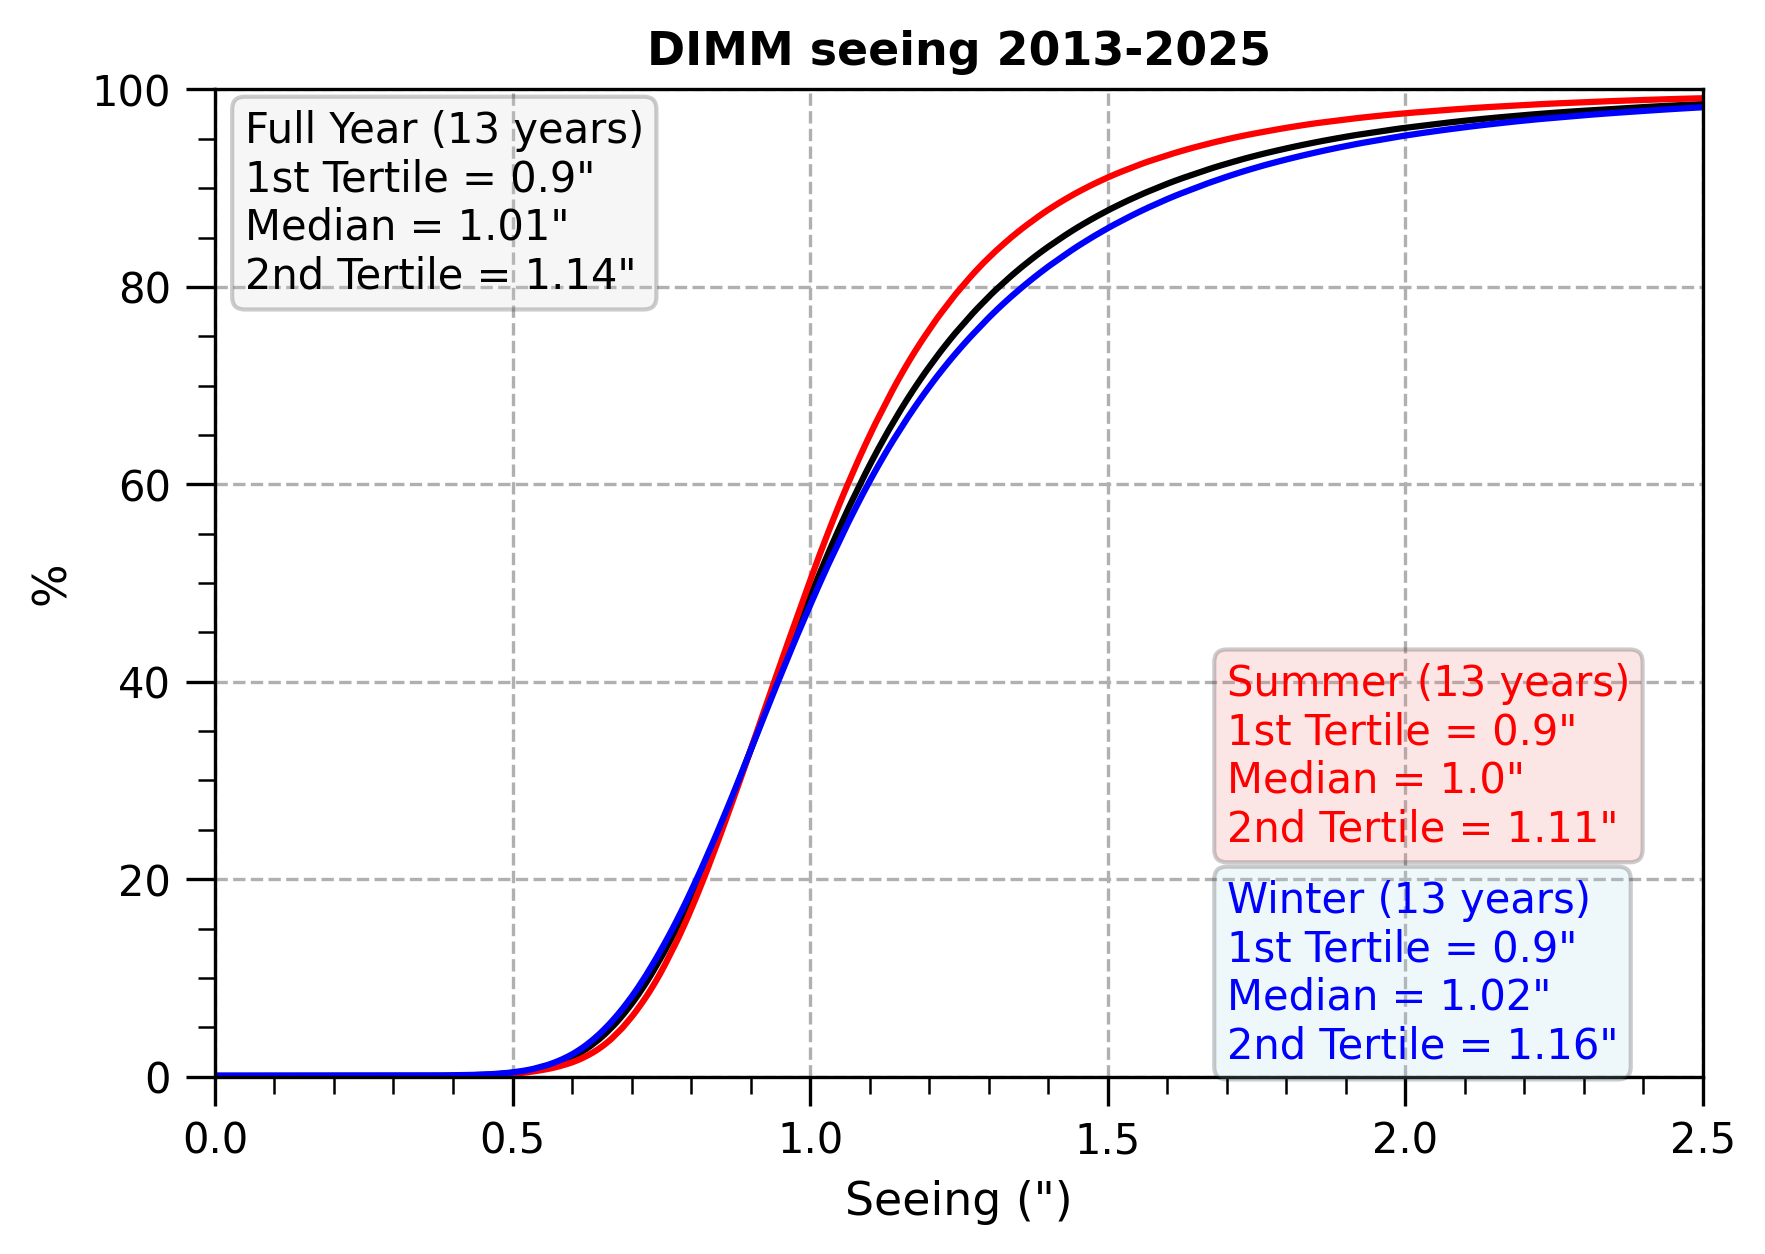
Climatological cumulative distribution of seeing measured by DIMM at LBT.
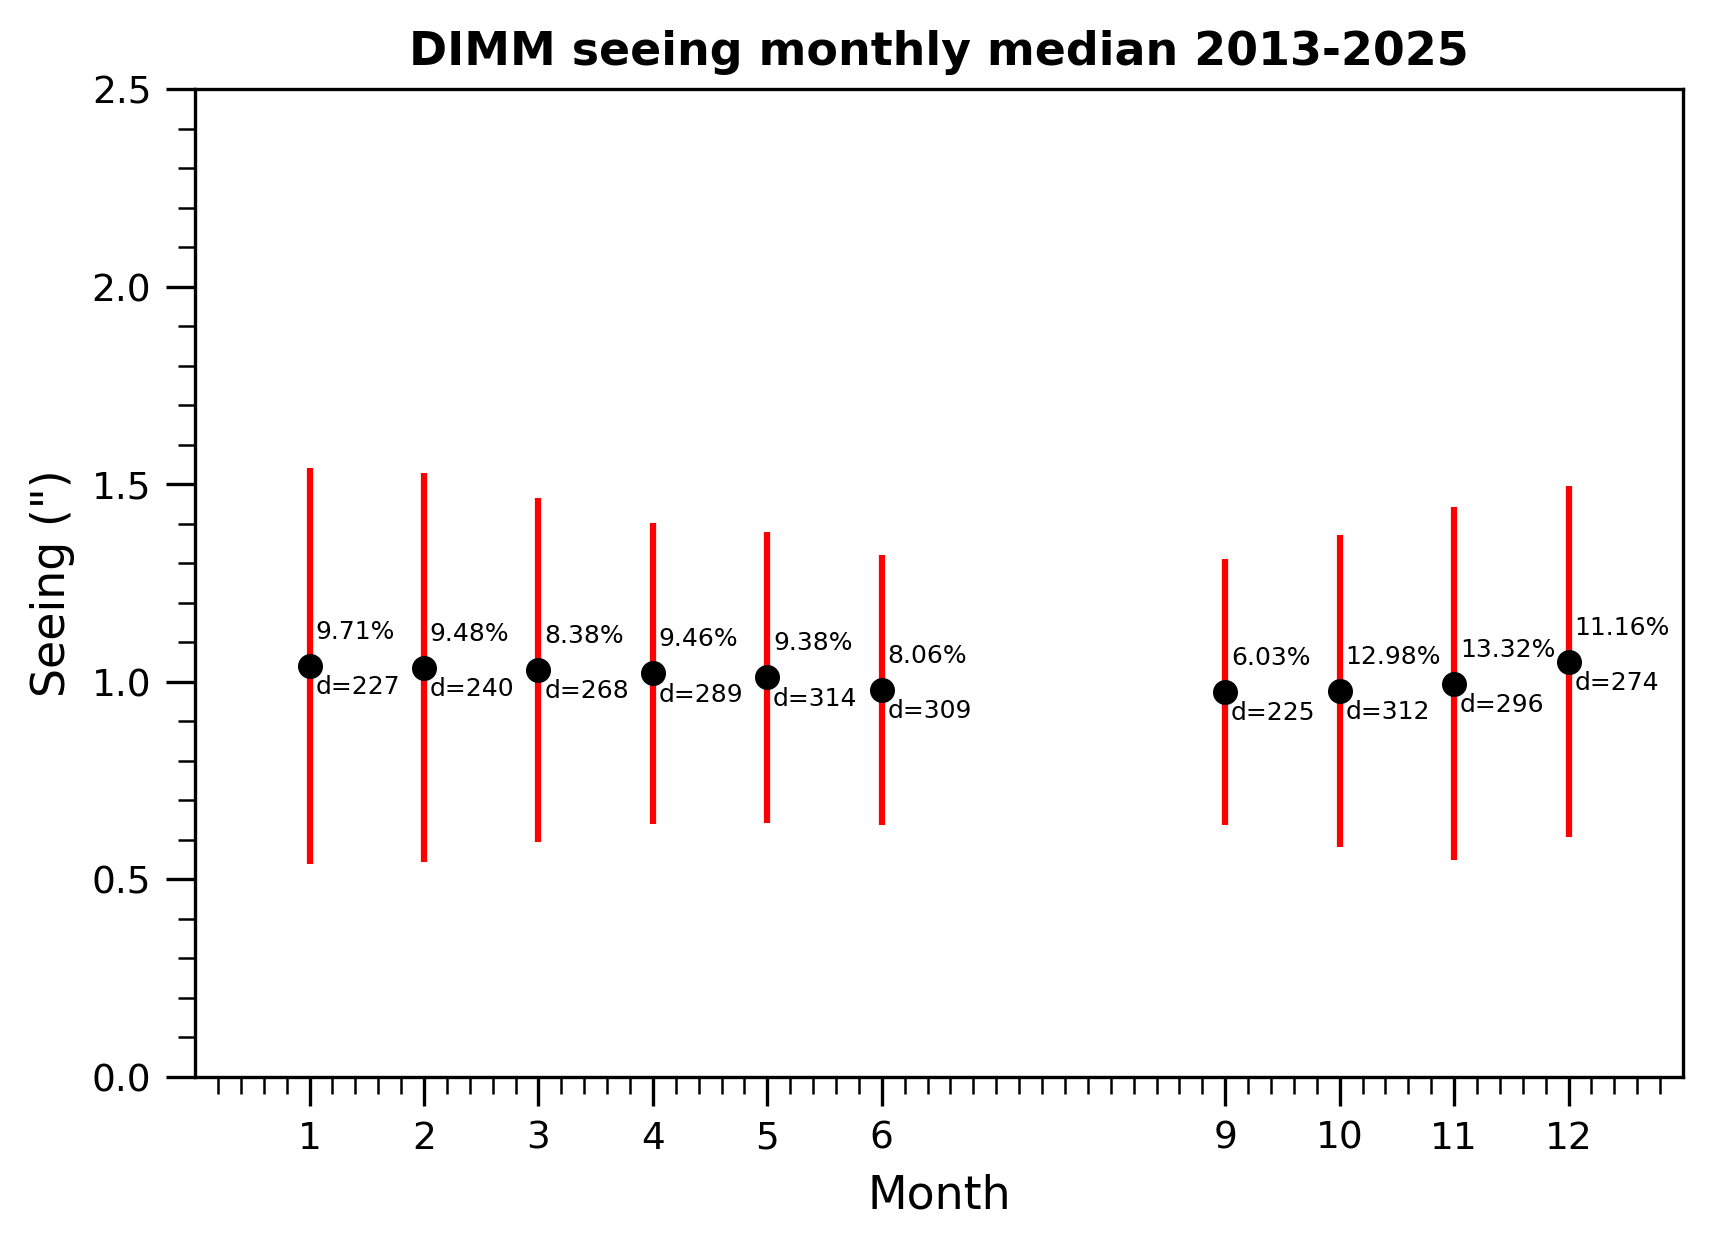
Monthly median seeing measured by DIMM at LBT. Values next to each dot represents the percentage of the samples in that month with respect to the total number of samples (top) and the total number of days in which measurements took place in that month (bottom). The red bar is the standard deviation. Values in July and August are not reported because LBT is shut down and there are no DIMM observations.
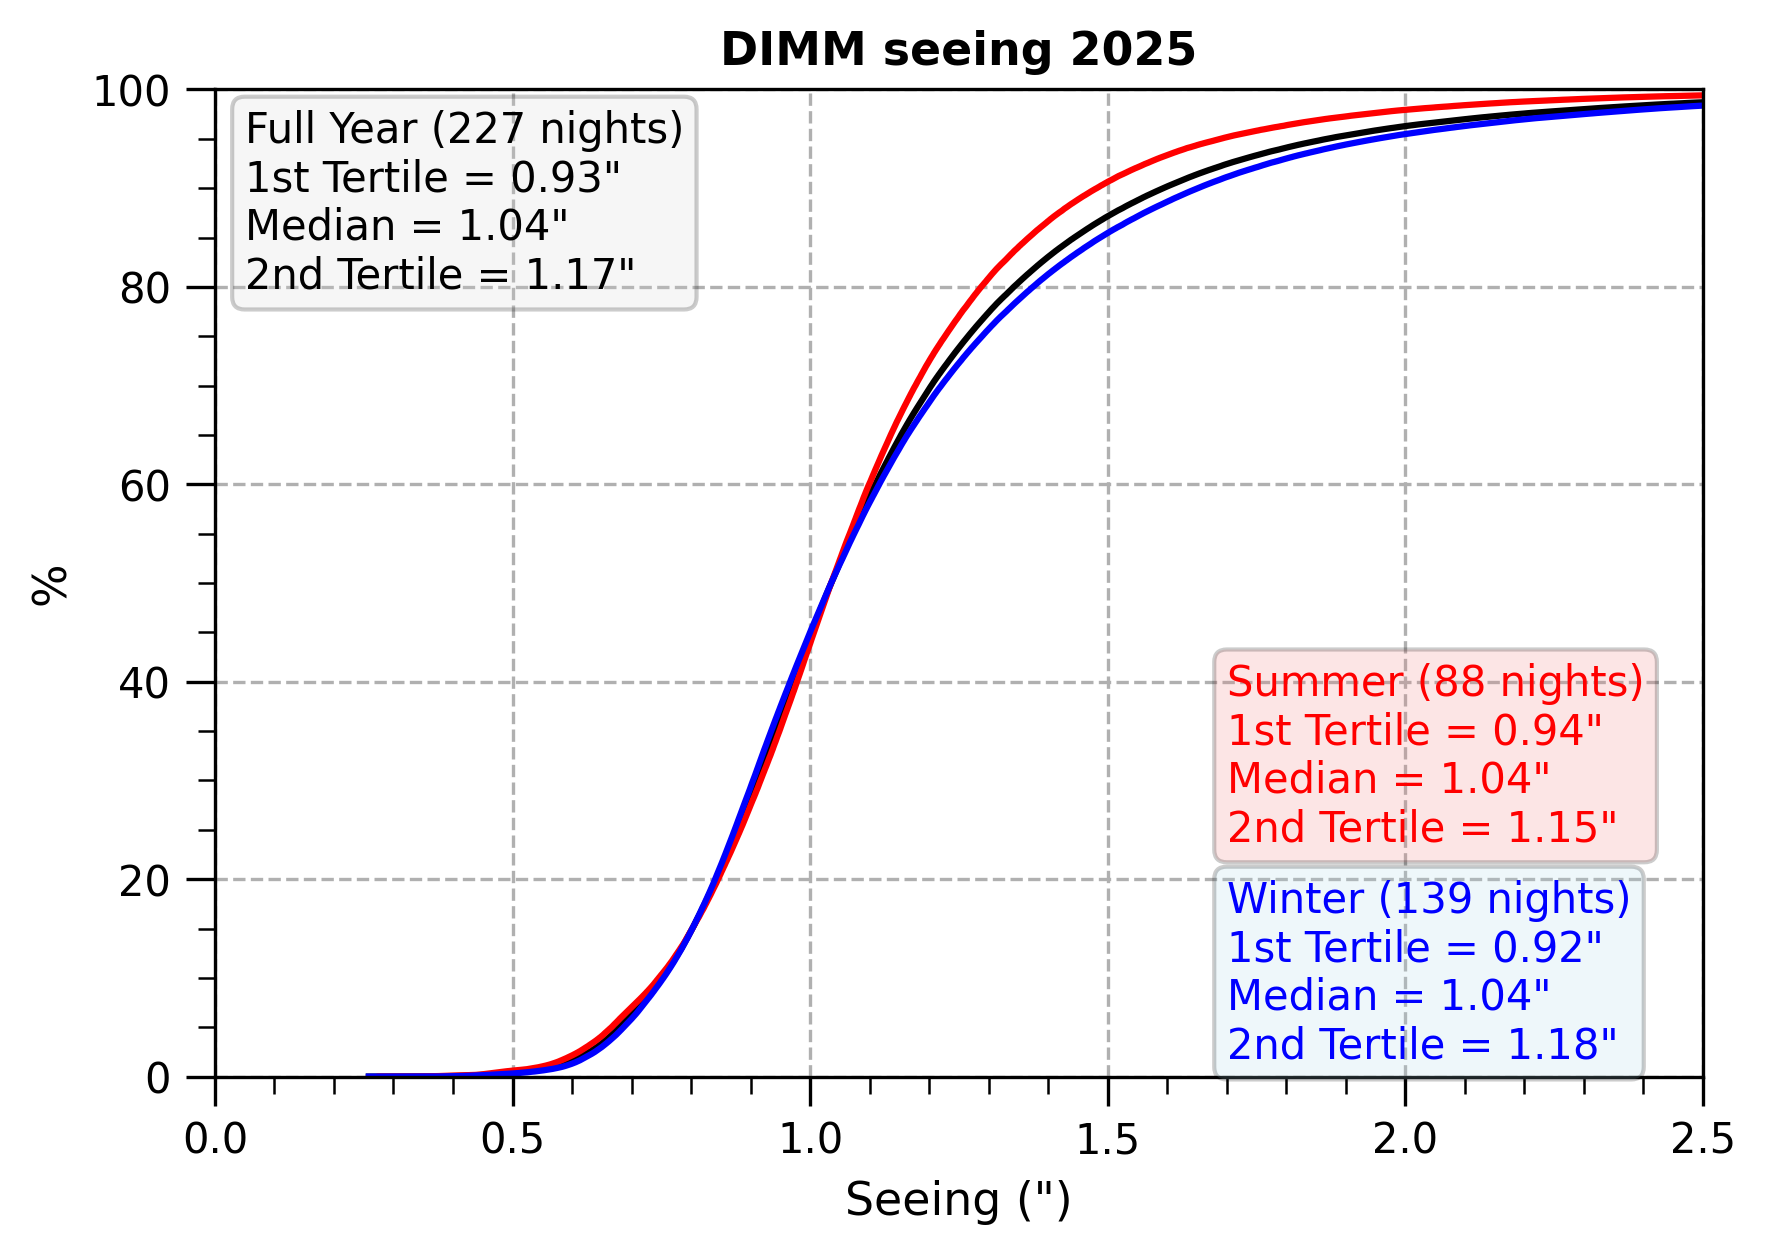
Fig. 13: Climatological cumulative distribution of seeing measured by DIMM at LBT. Year 2025.
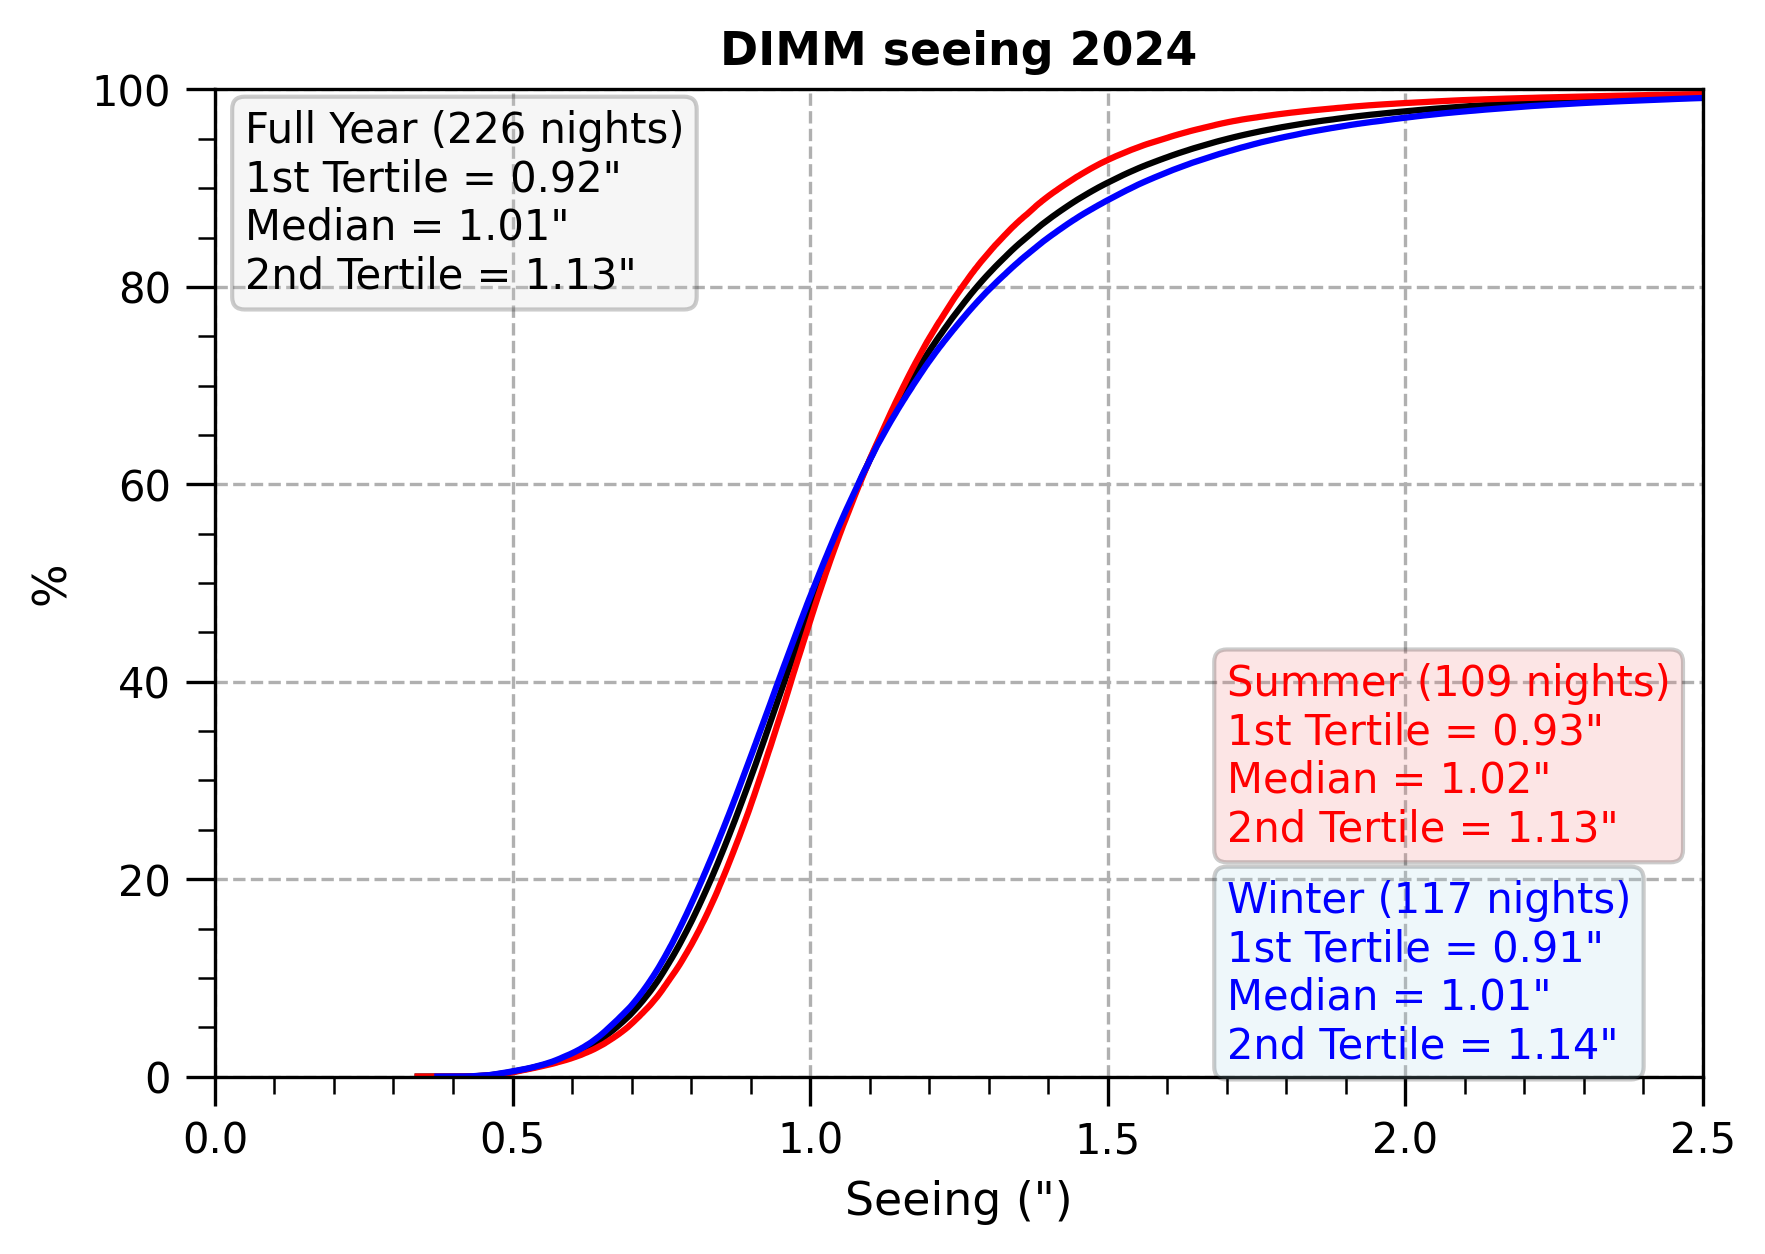
Fig. 12: Climatological cumulative distribution of seeing measured by DIMM at LBT. Year 2024.
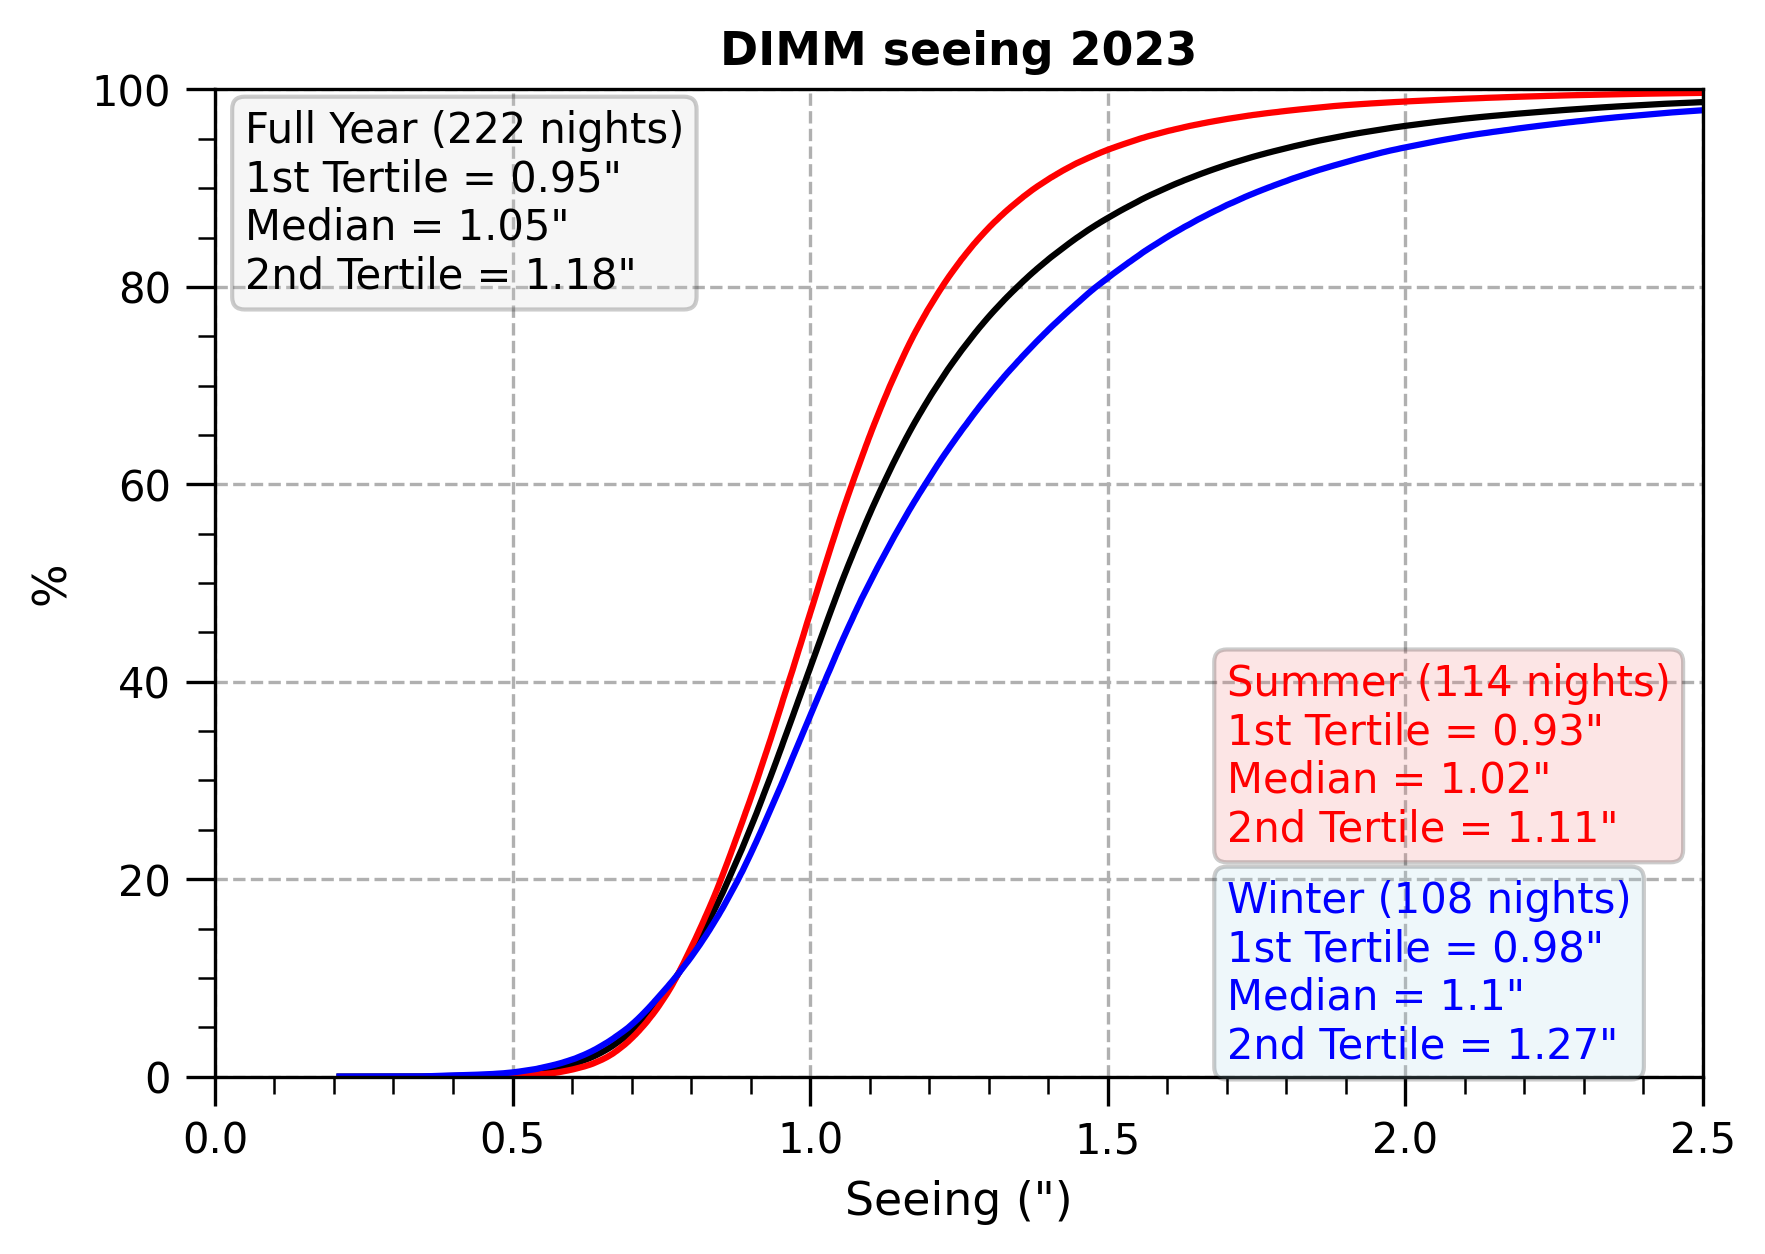
Fig. 11: Climatological cumulative distribution of seeing measured by DIMM at LBT. Year 2023.
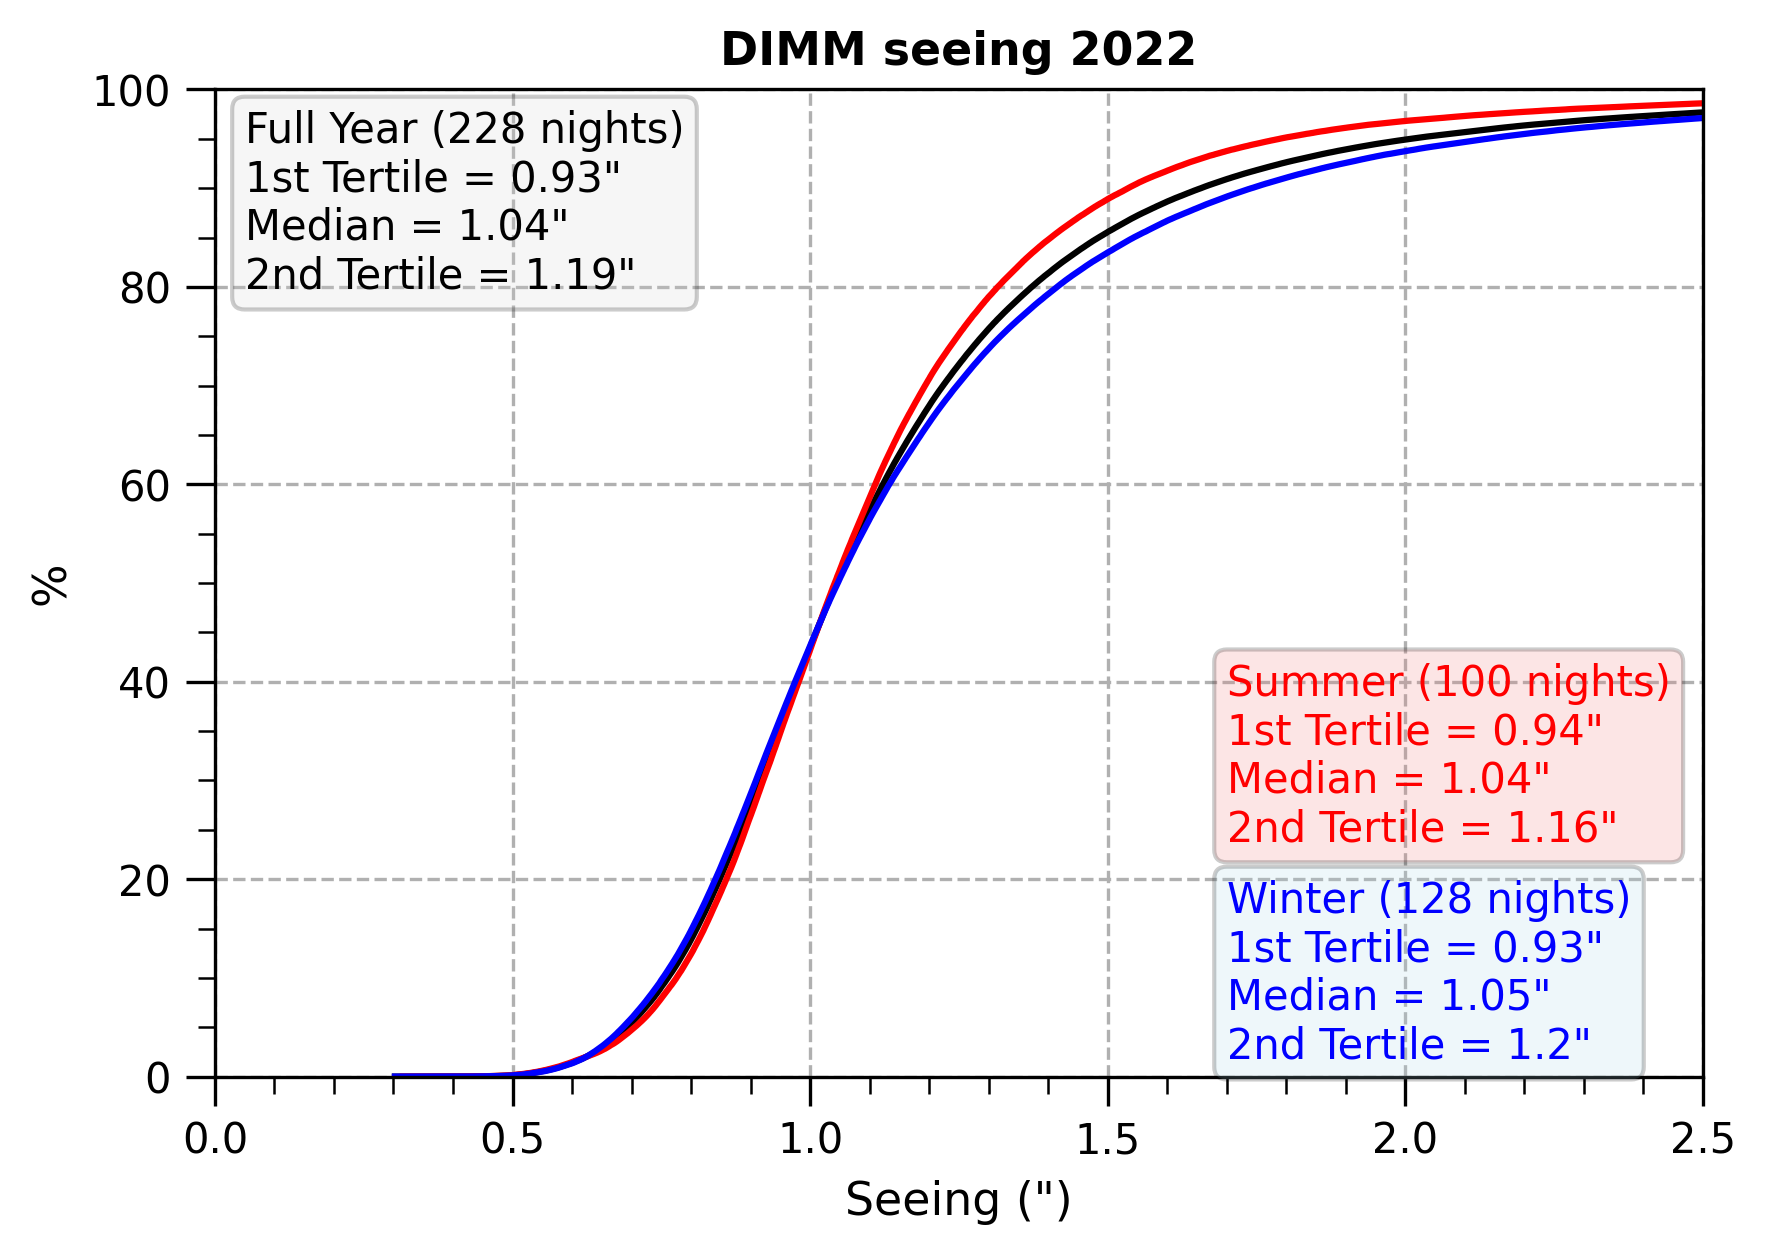
Fig. 10: Climatological cumulative distribution of seeing measured by DIMM at LBT. Year 2022.
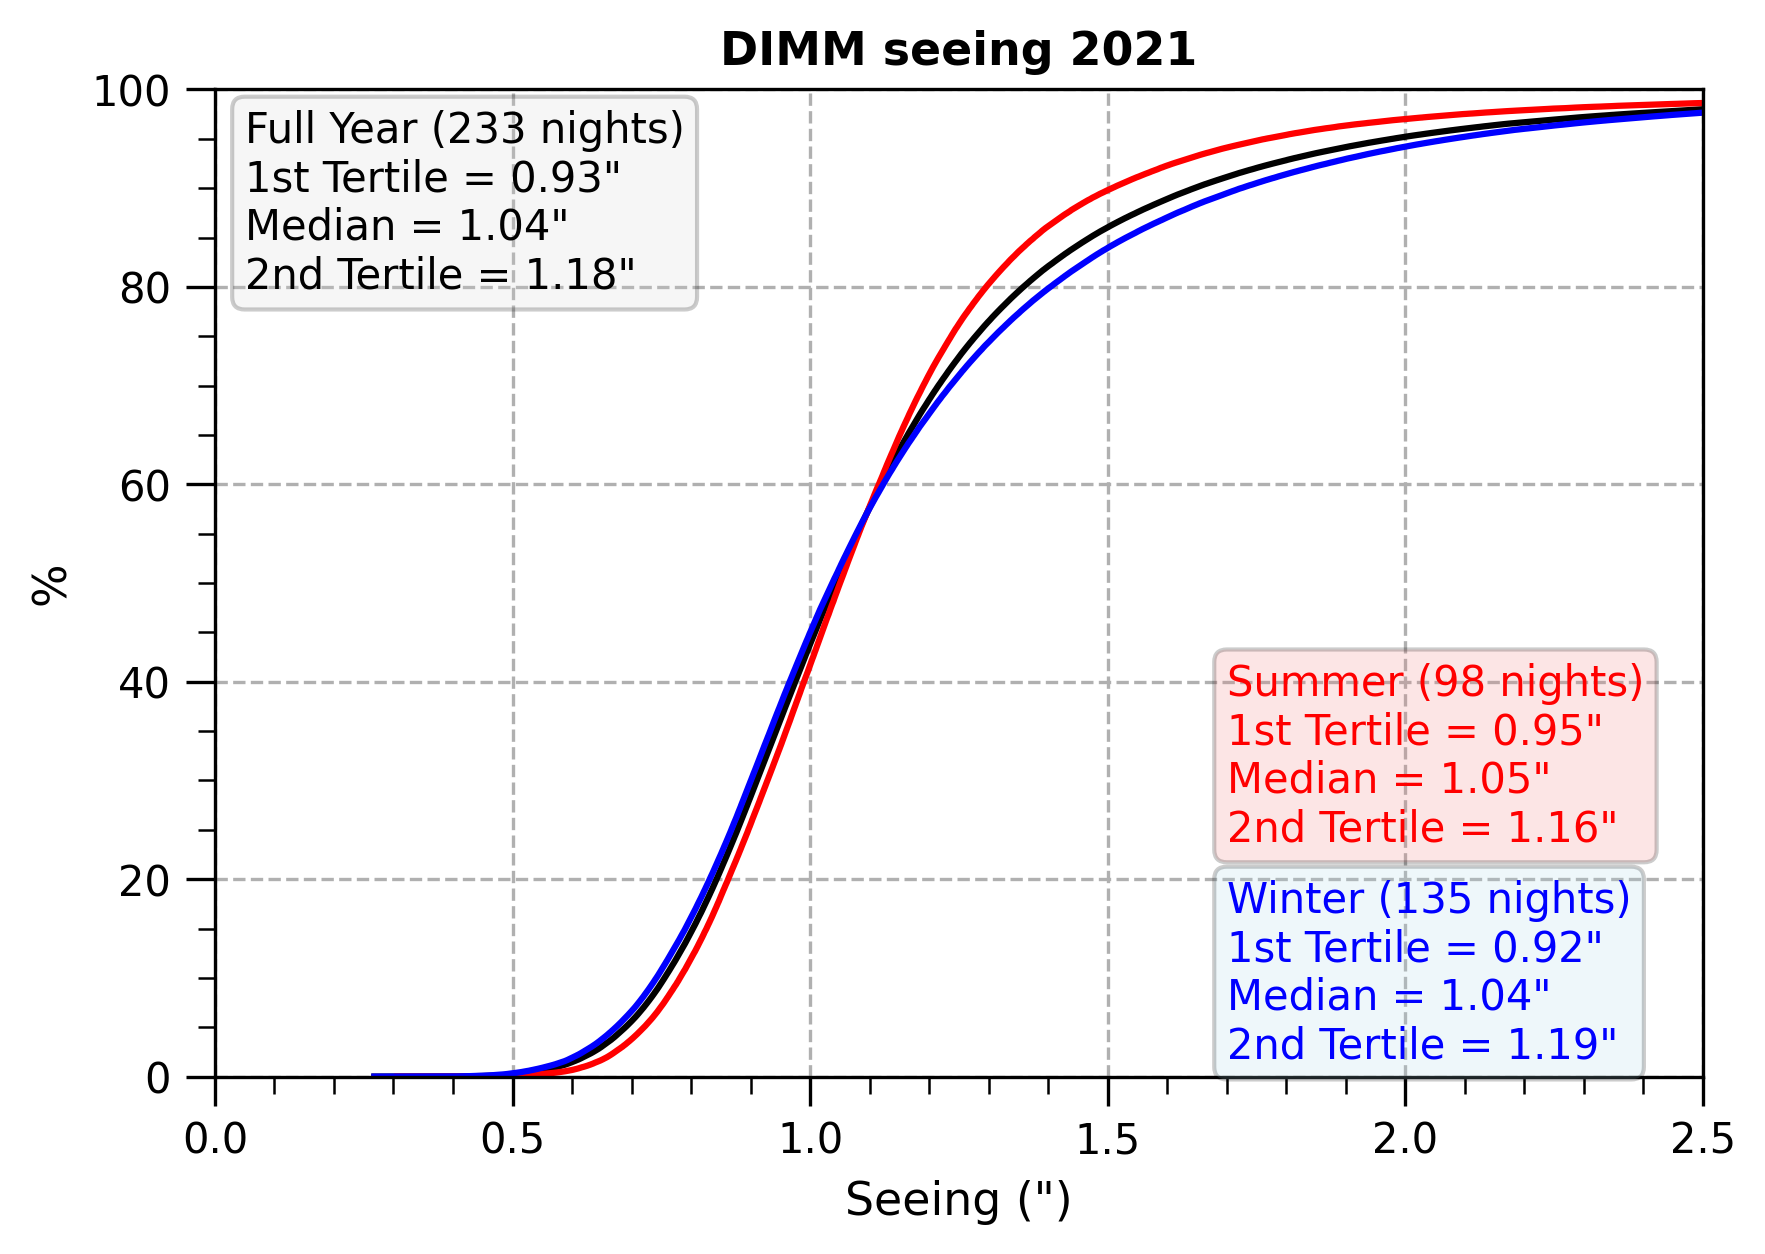
Fig. 9: Climatological cumulative distribution of seeing measured by DIMM at LBT. Year 2021.
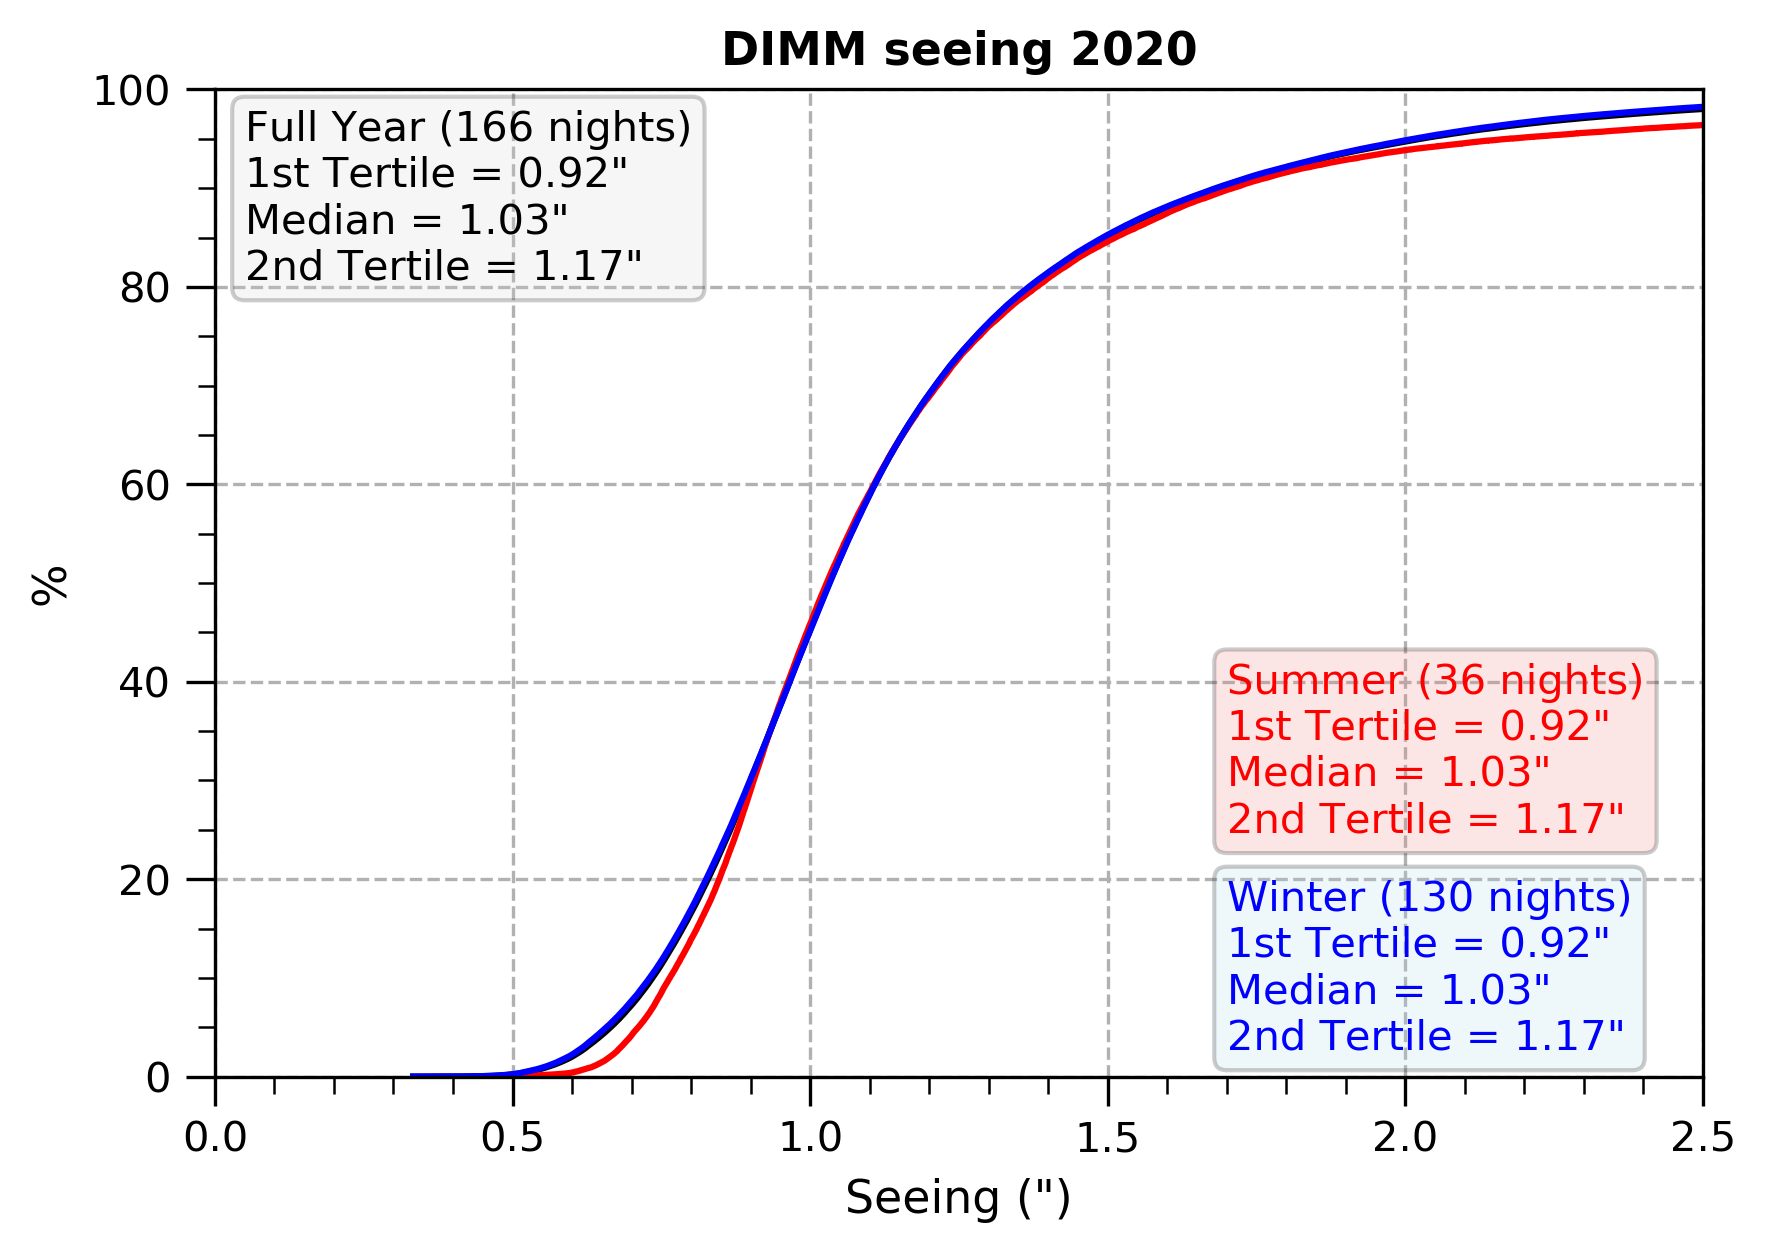
Fig. 8: Climatological cumulative distribution of seeing measured by DIMM at LBT. Year 2020.
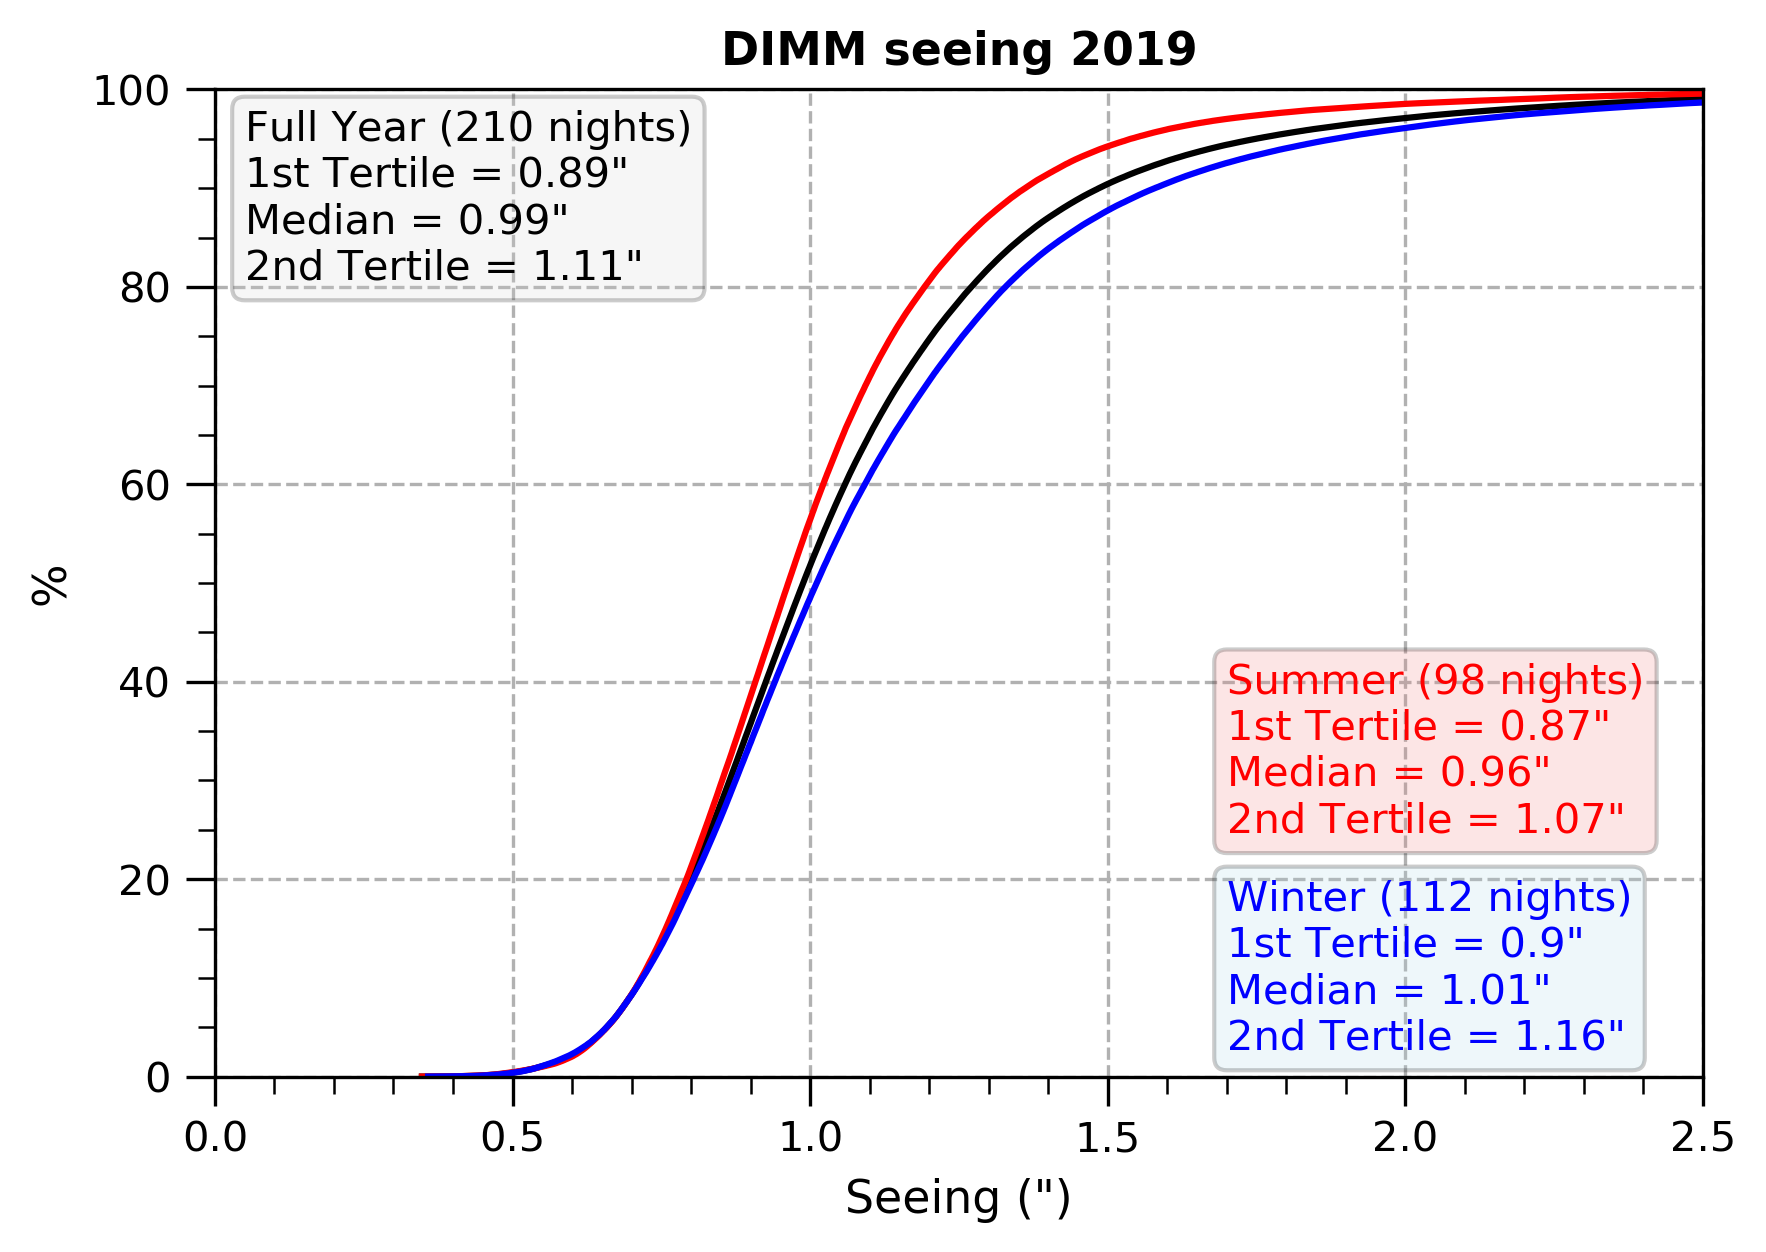
Fig. 7: Climatological cumulative distribution of seeing measured by DIMM at LBT. Year 2019.
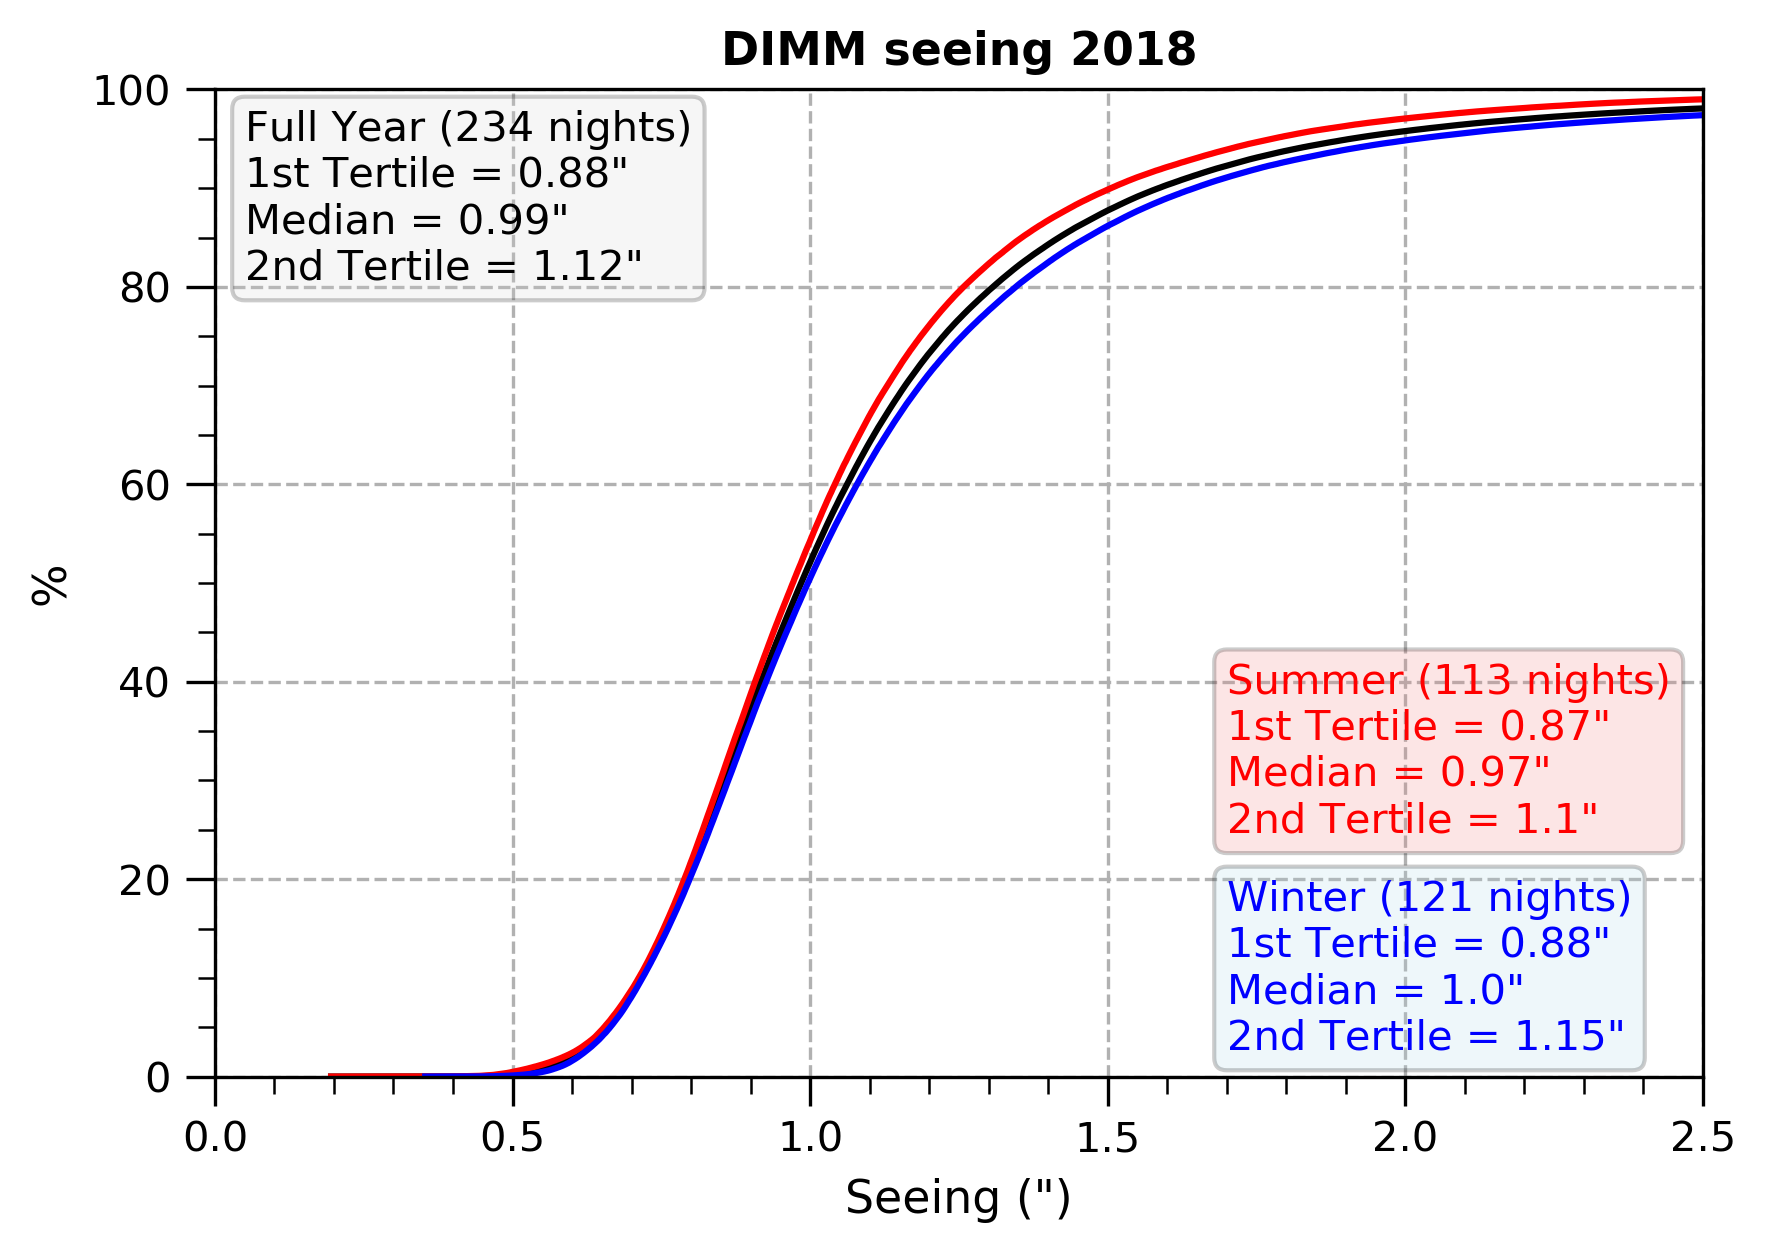
Fig. 6: Climatological cumulative distribution of seeing measured by DIMM at LBT. Year 2018.
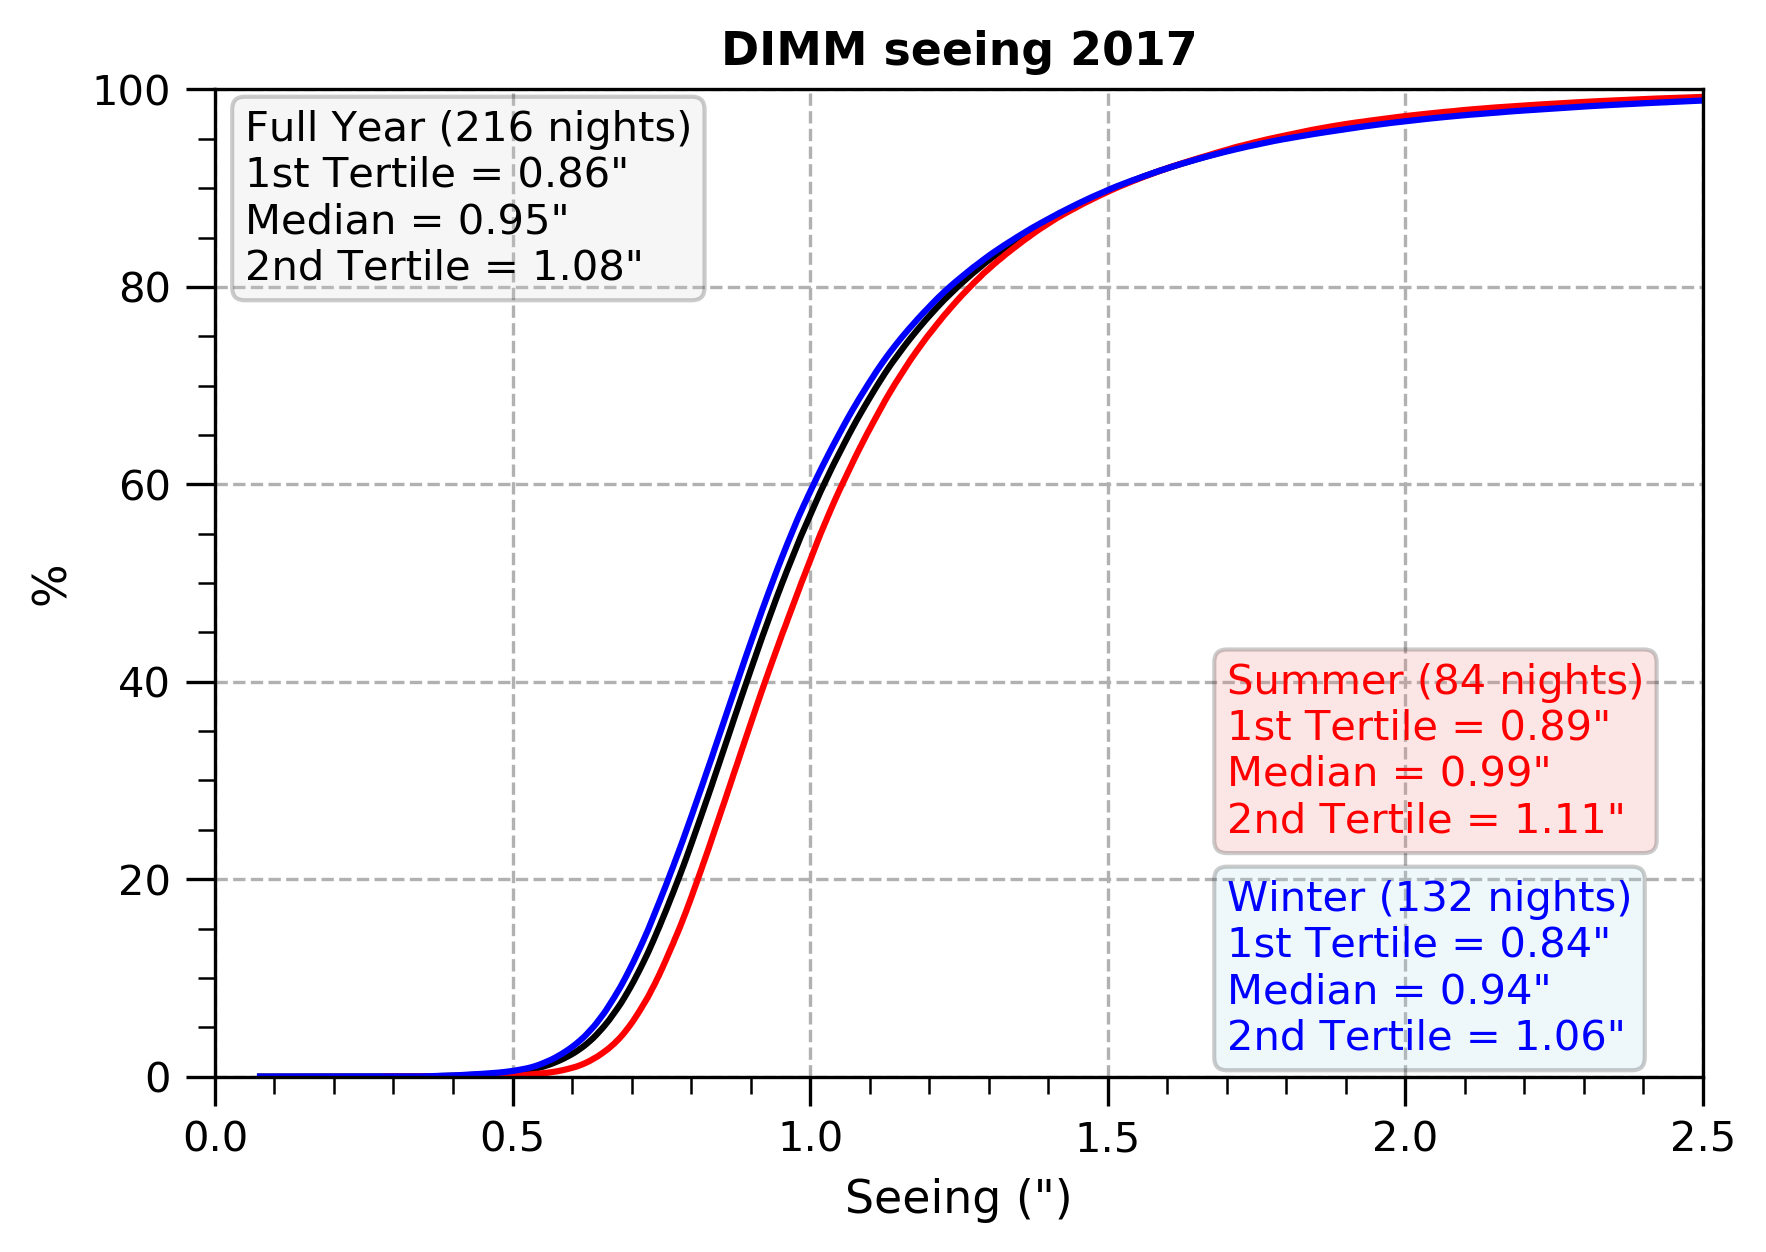
Fig. 5: Climatological cumulative distribution of seeing measured by DIMM at LBT. Year 2017.
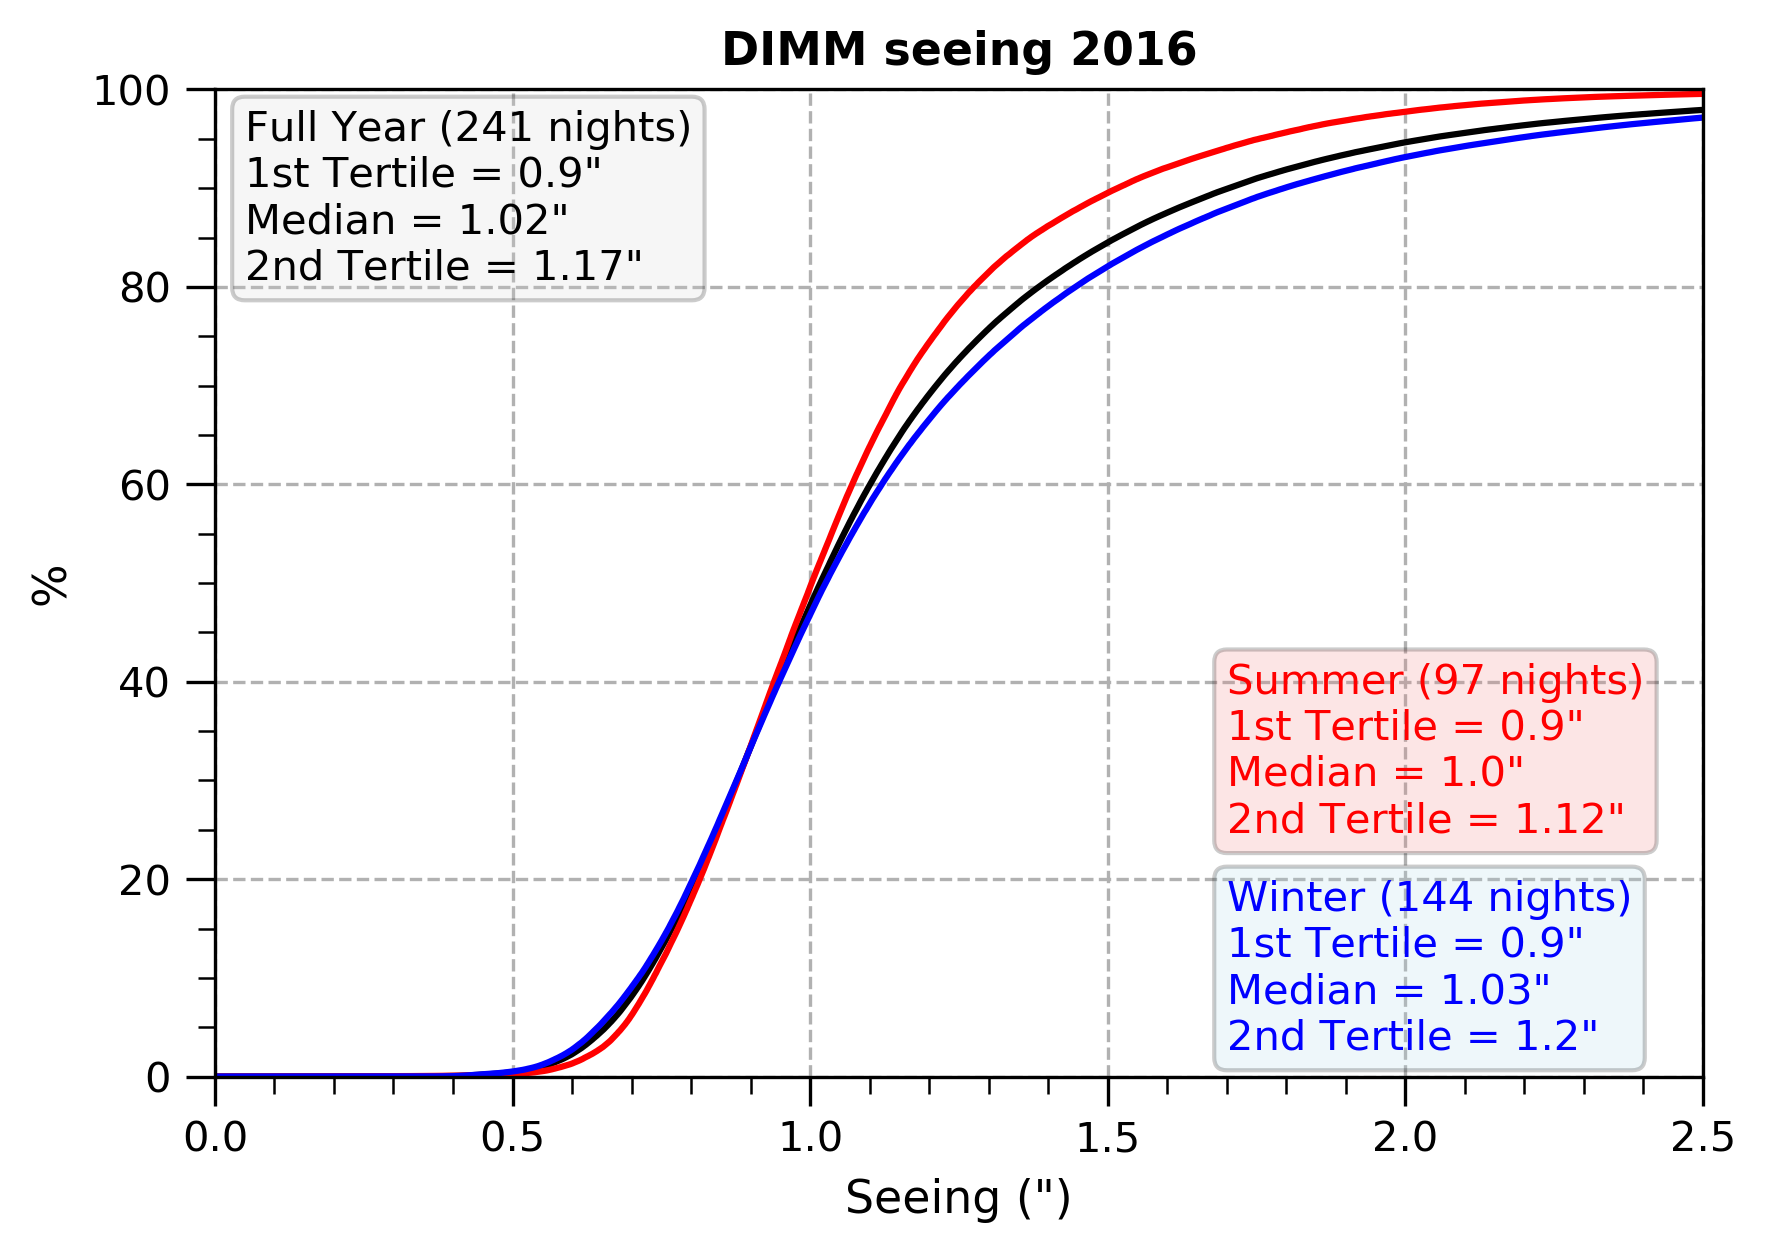
Fig. 4: Climatological cumulative distribution of seeing measured by DIMM at LBT. Year 2016.
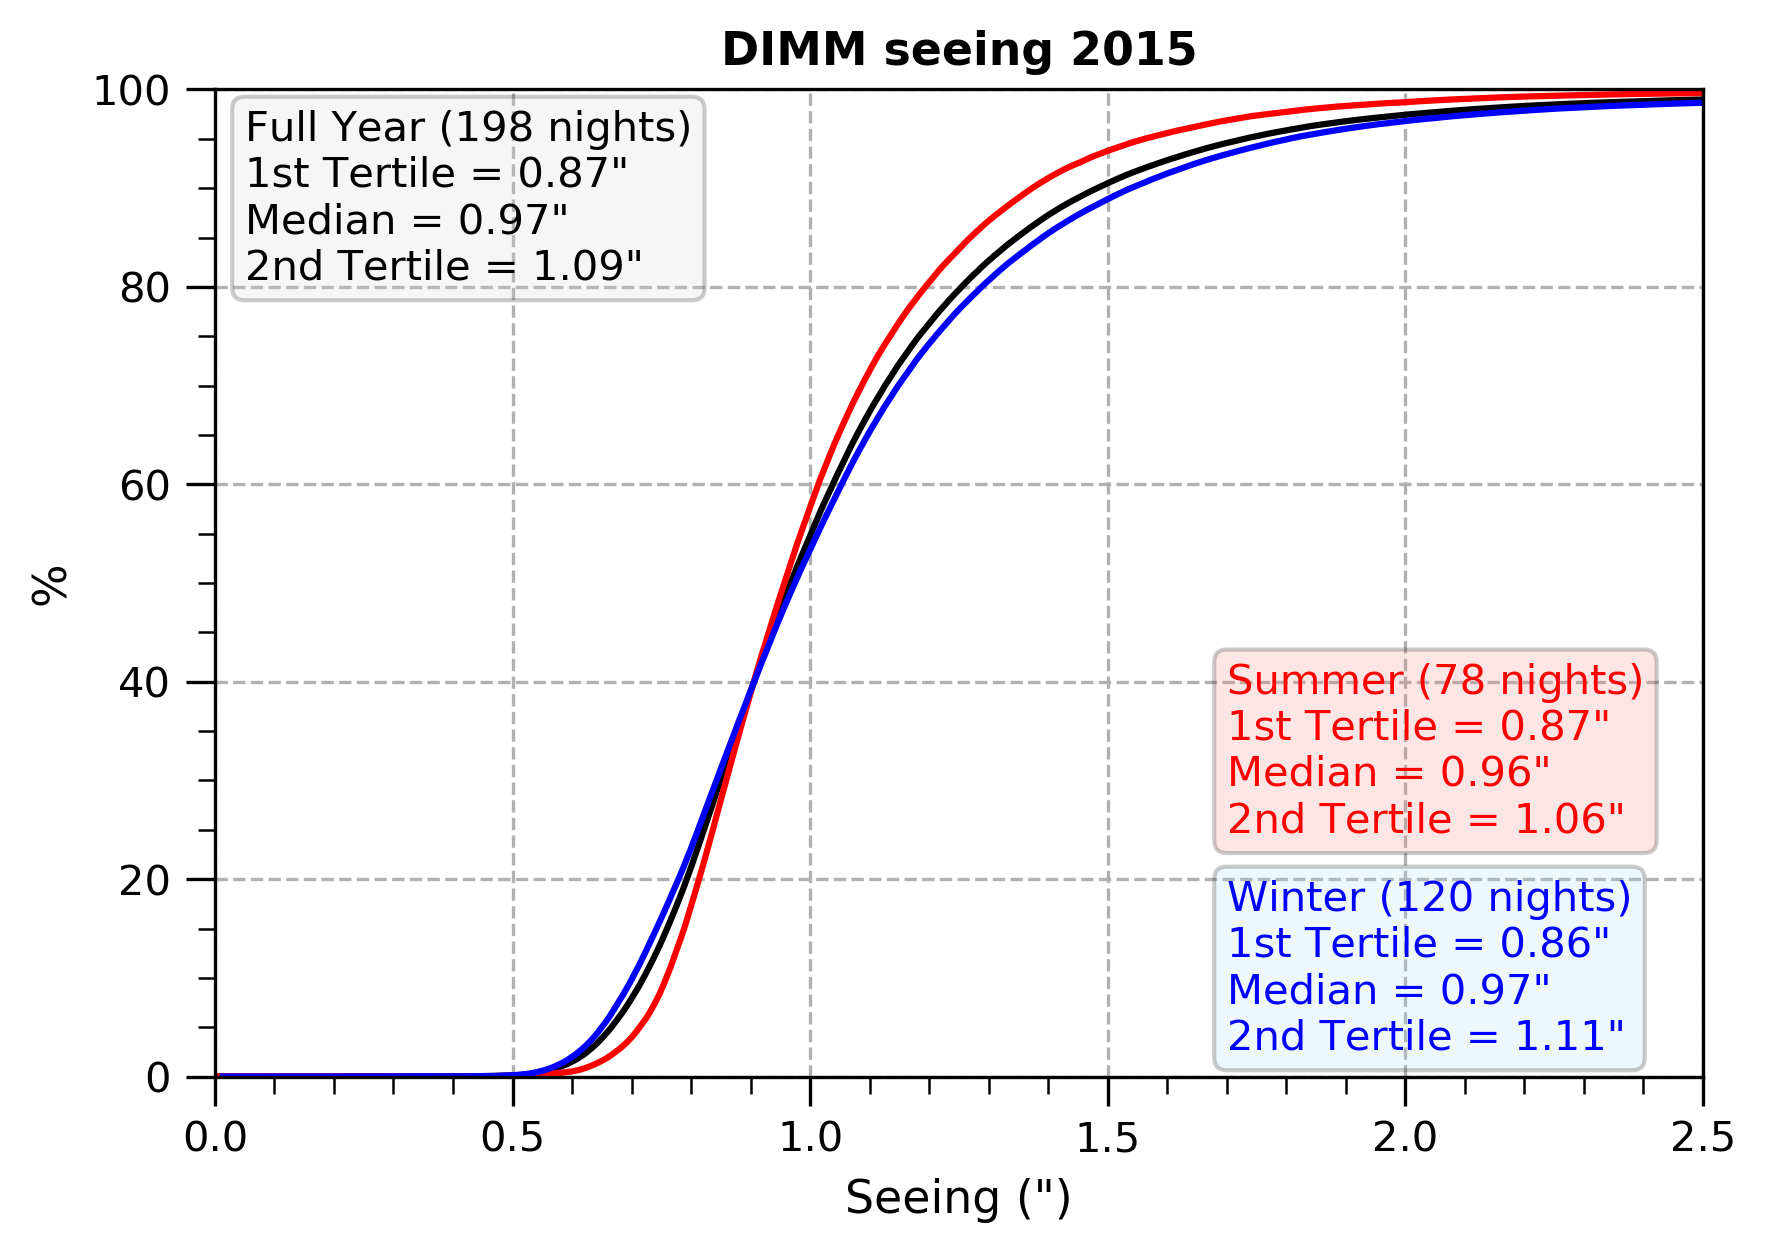
Fig. 3: Climatological cumulative distribution of seeing measured by DIMM at LBT. Year 2015.
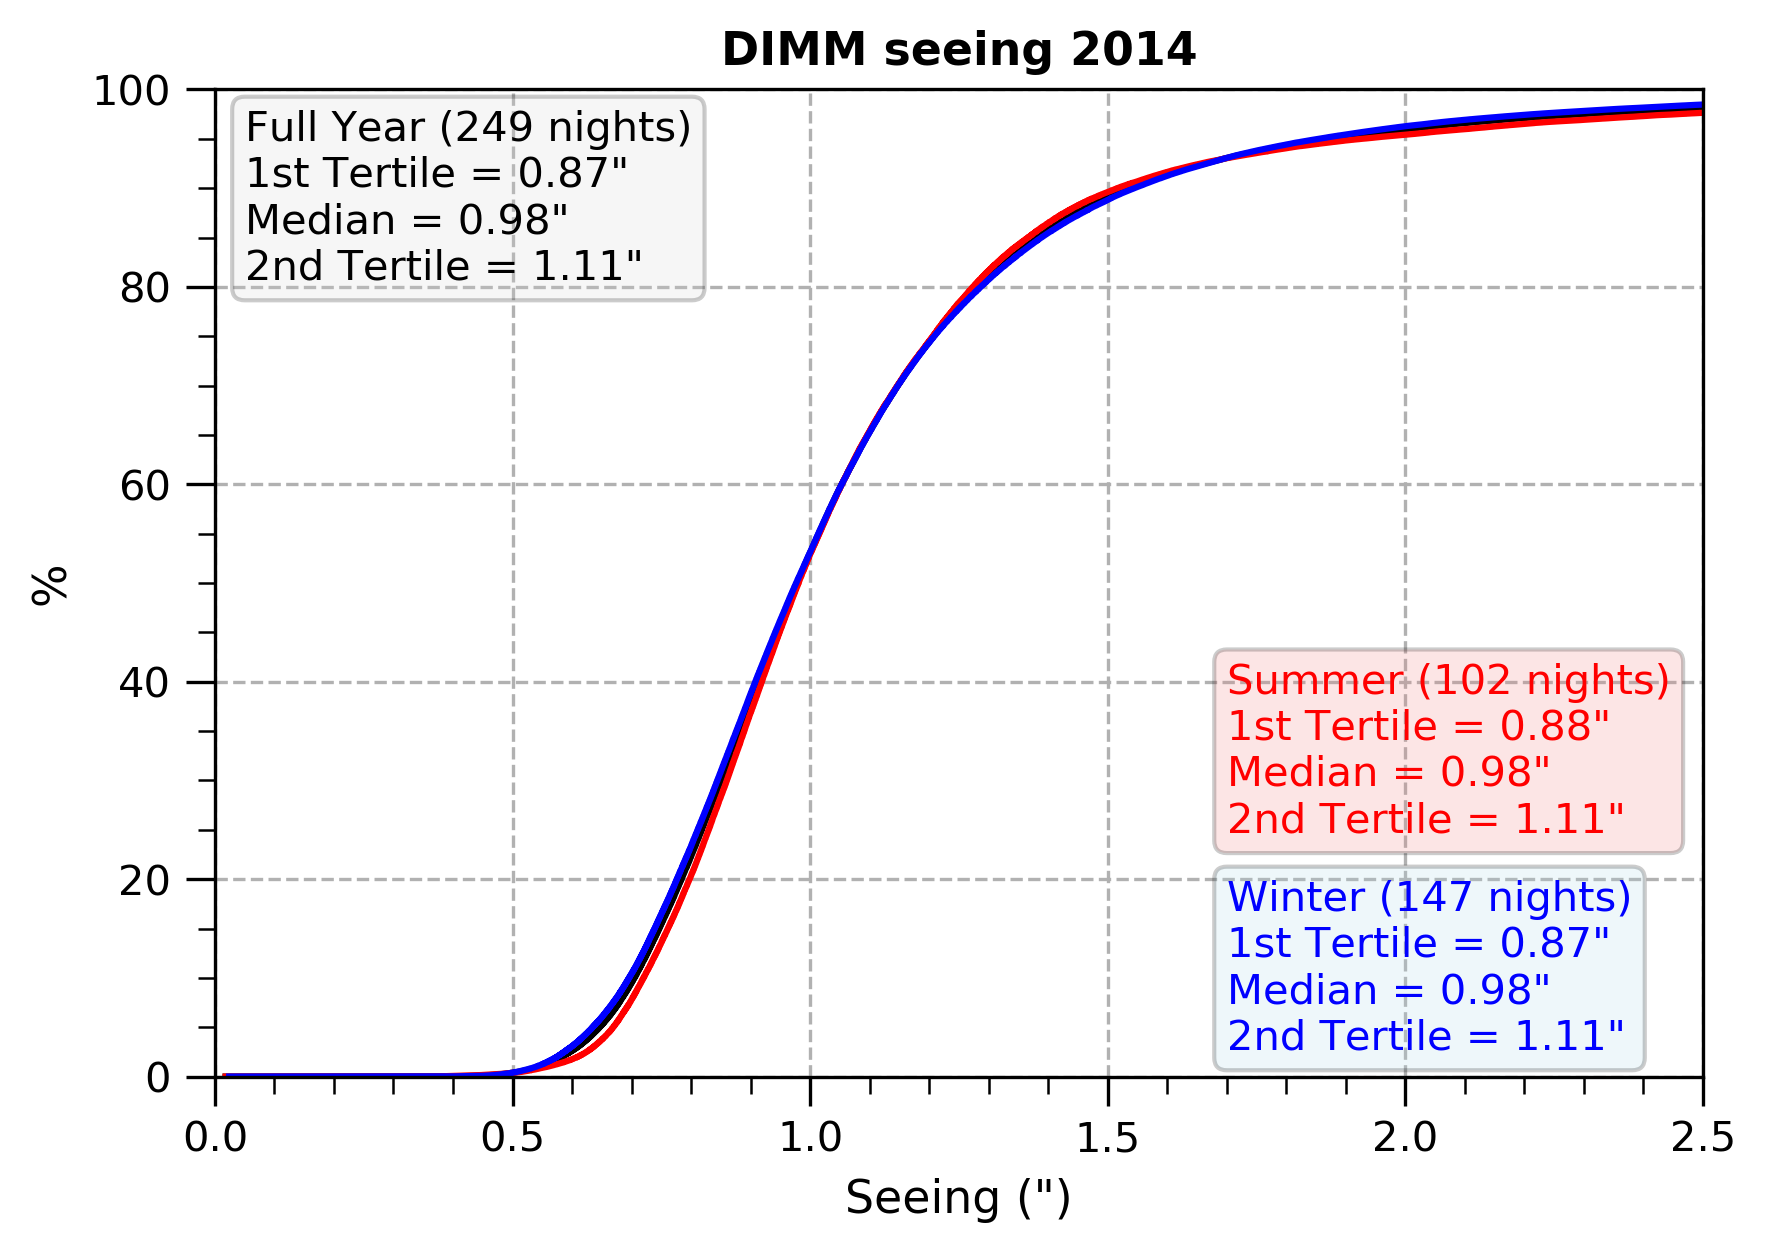
Fig. 2: Climatological cumulative distribution of seeing measured by DIMM at LBT. Year 2014.
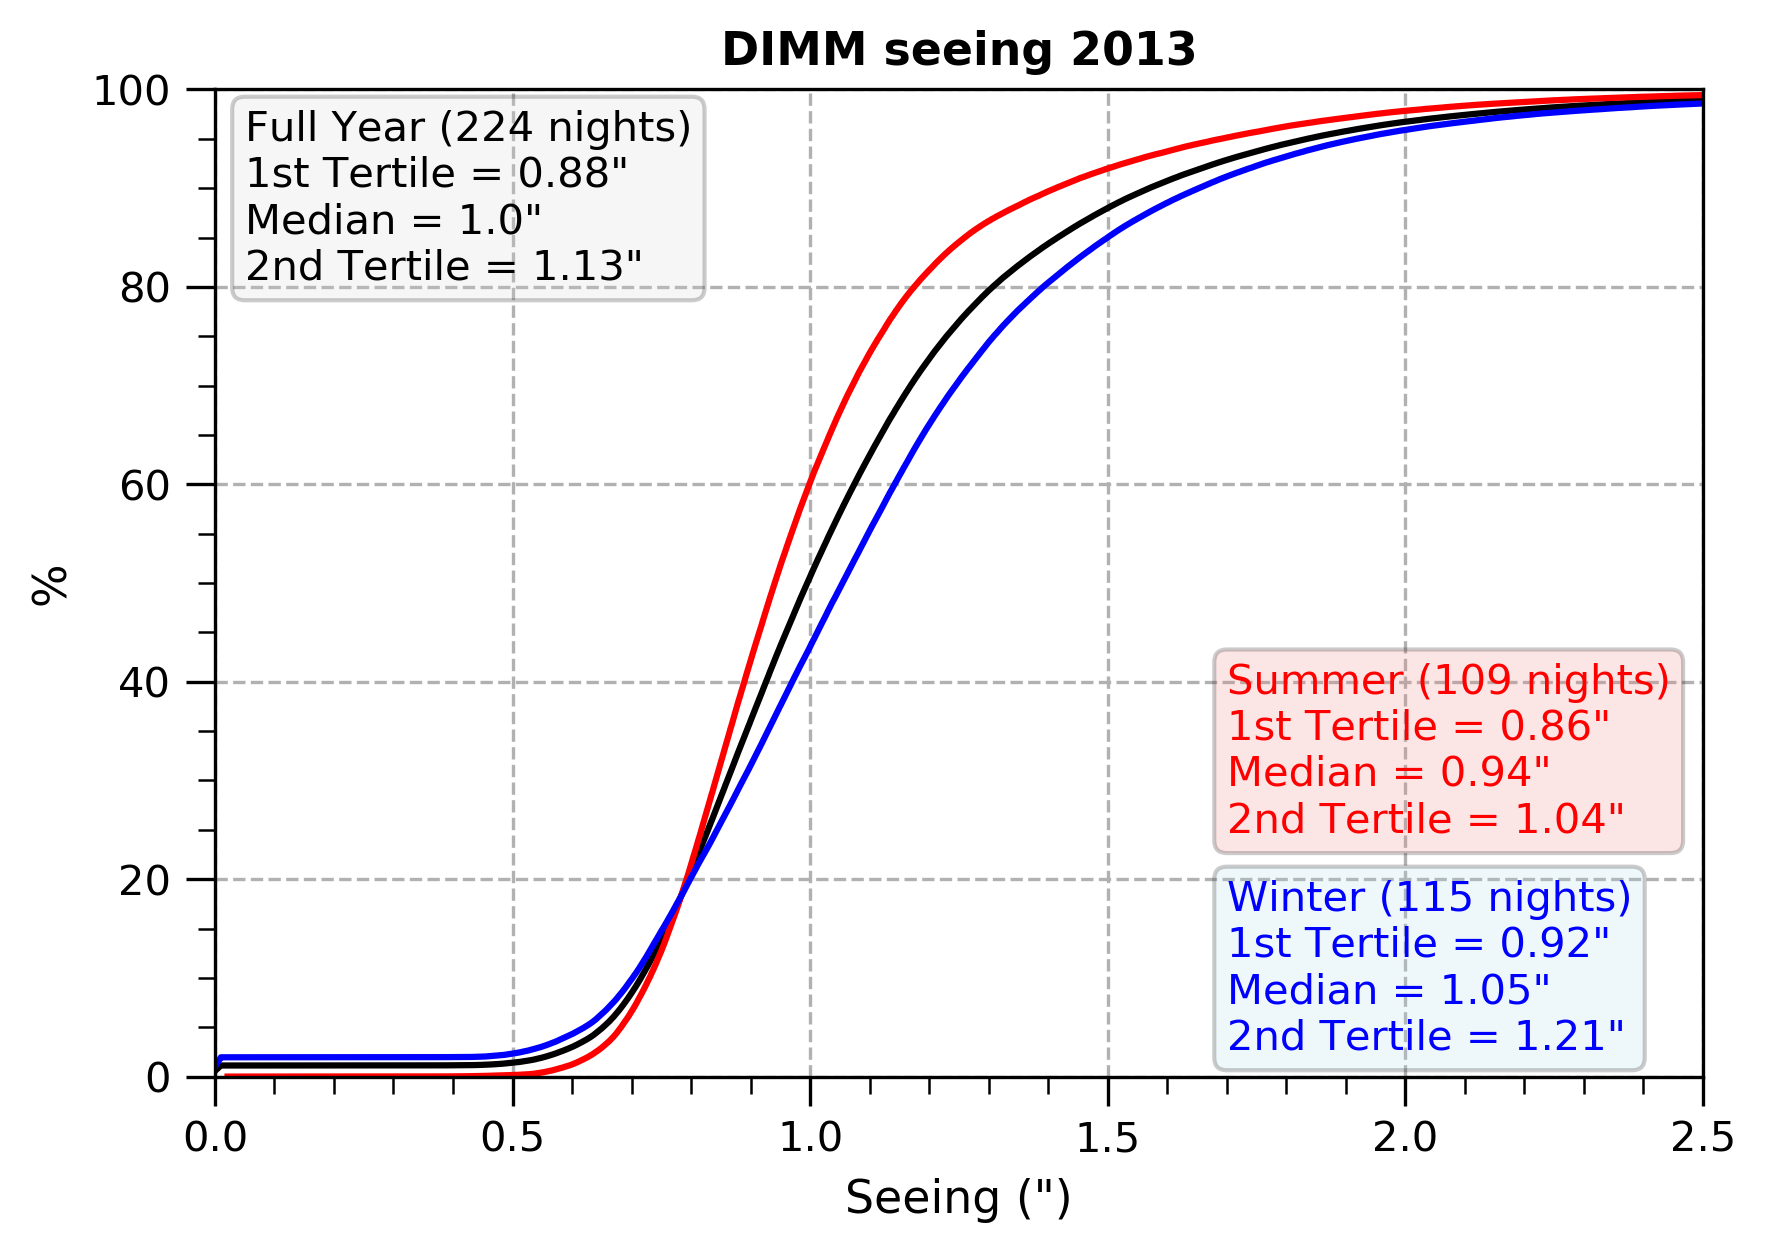
Fig. 1: Climatological cumulative distribution of seeing measured by DIMM at LBT. Year 2013.