Temporal evolution at ground
Forecast relative to the night starting on 2026/07/25 MST
Note: click on a figure to magnify the image. Date of figures refers to the start of night in MST.
Wind speed temporal evolution between the sunset and the sunrise. Astronomical dusk and dawn are shown too. Wind speed values are representative of the first vertical grid points of the model. Specifically three levels are represented:
Level K=2 —> 8.5m a.g.l. (representative of the [0-17]m vertical slab).
Level K=3 —> 27.5m a.g.l. (representative of the [17-38]m vertical slab).
Level K=4 —> 50m a.g.l. (representative of the [38-62]m vertical slab).
On the x-axis is time in UT (bottom), in MST (top). Raw data points frequency is equal to the model time-step (typically from a fraction of second up to a few seconds, depending on the model configuration used). Data points are re-sampled at a temporal frequency of 20 minutes after a 1-hour moving average. The error bars are the sigma over the 20 minutes sampling, computed before the moving average.
Wind direction is displayed on the range [0°-360°] on y-axis. 0°: wind blowing from the North. 90°: wind blowing from the Est. The scale is 360° periodic. It may happen that the scale is repeated multiple times if the wind spirals over itself.
For those cases in which there are in-situ real-time measurements, the website displays the following outputs:
- BLACK LINE: model forecast displayed at 14:00 MST.
- GREEN LINE: real-time measurements treated with a 1h moving average as the forecasts.
- RED LINE: short time scale forecasts computed each full hour and extended on the successive four hours.
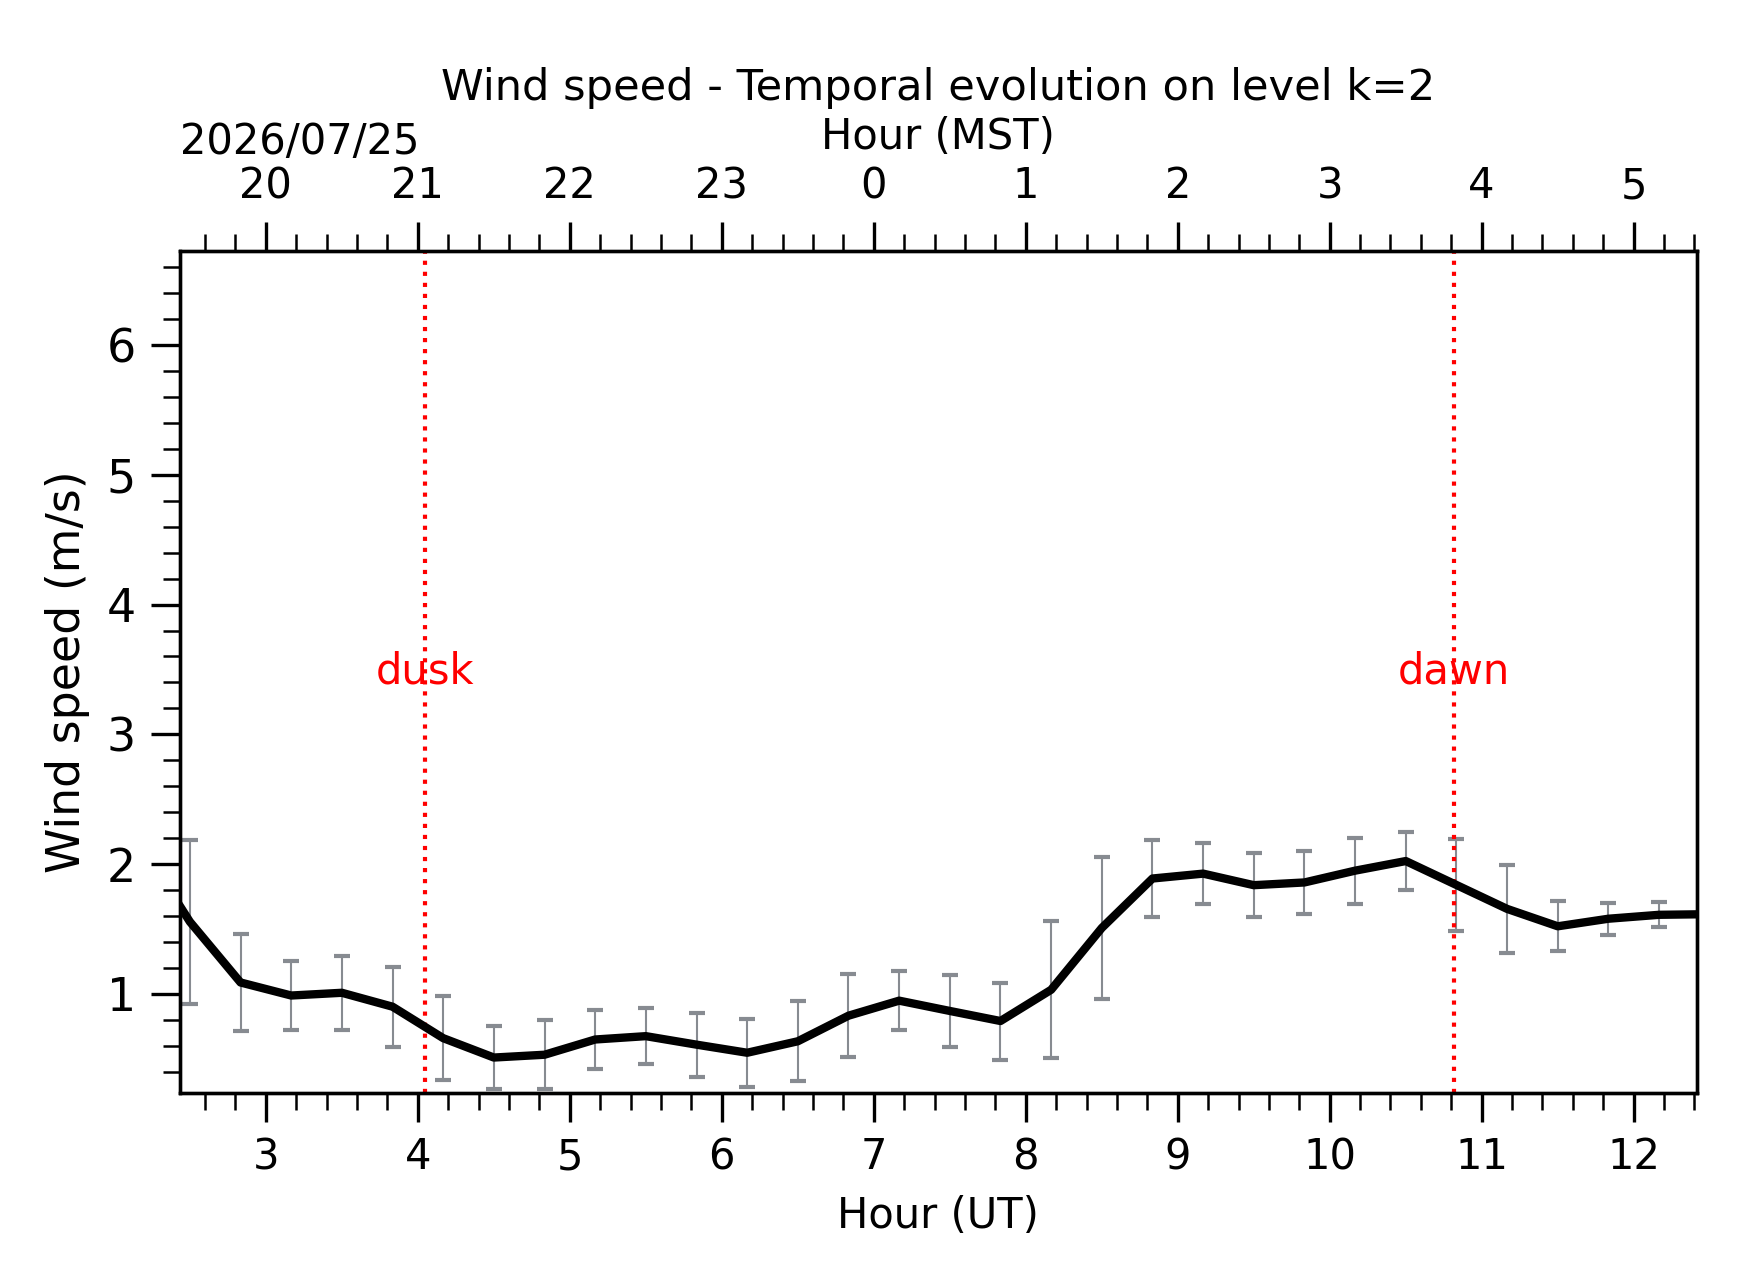
Fig. 1: Wind speed temporal evolution between the sunset and the sunrise at [0-17]m.
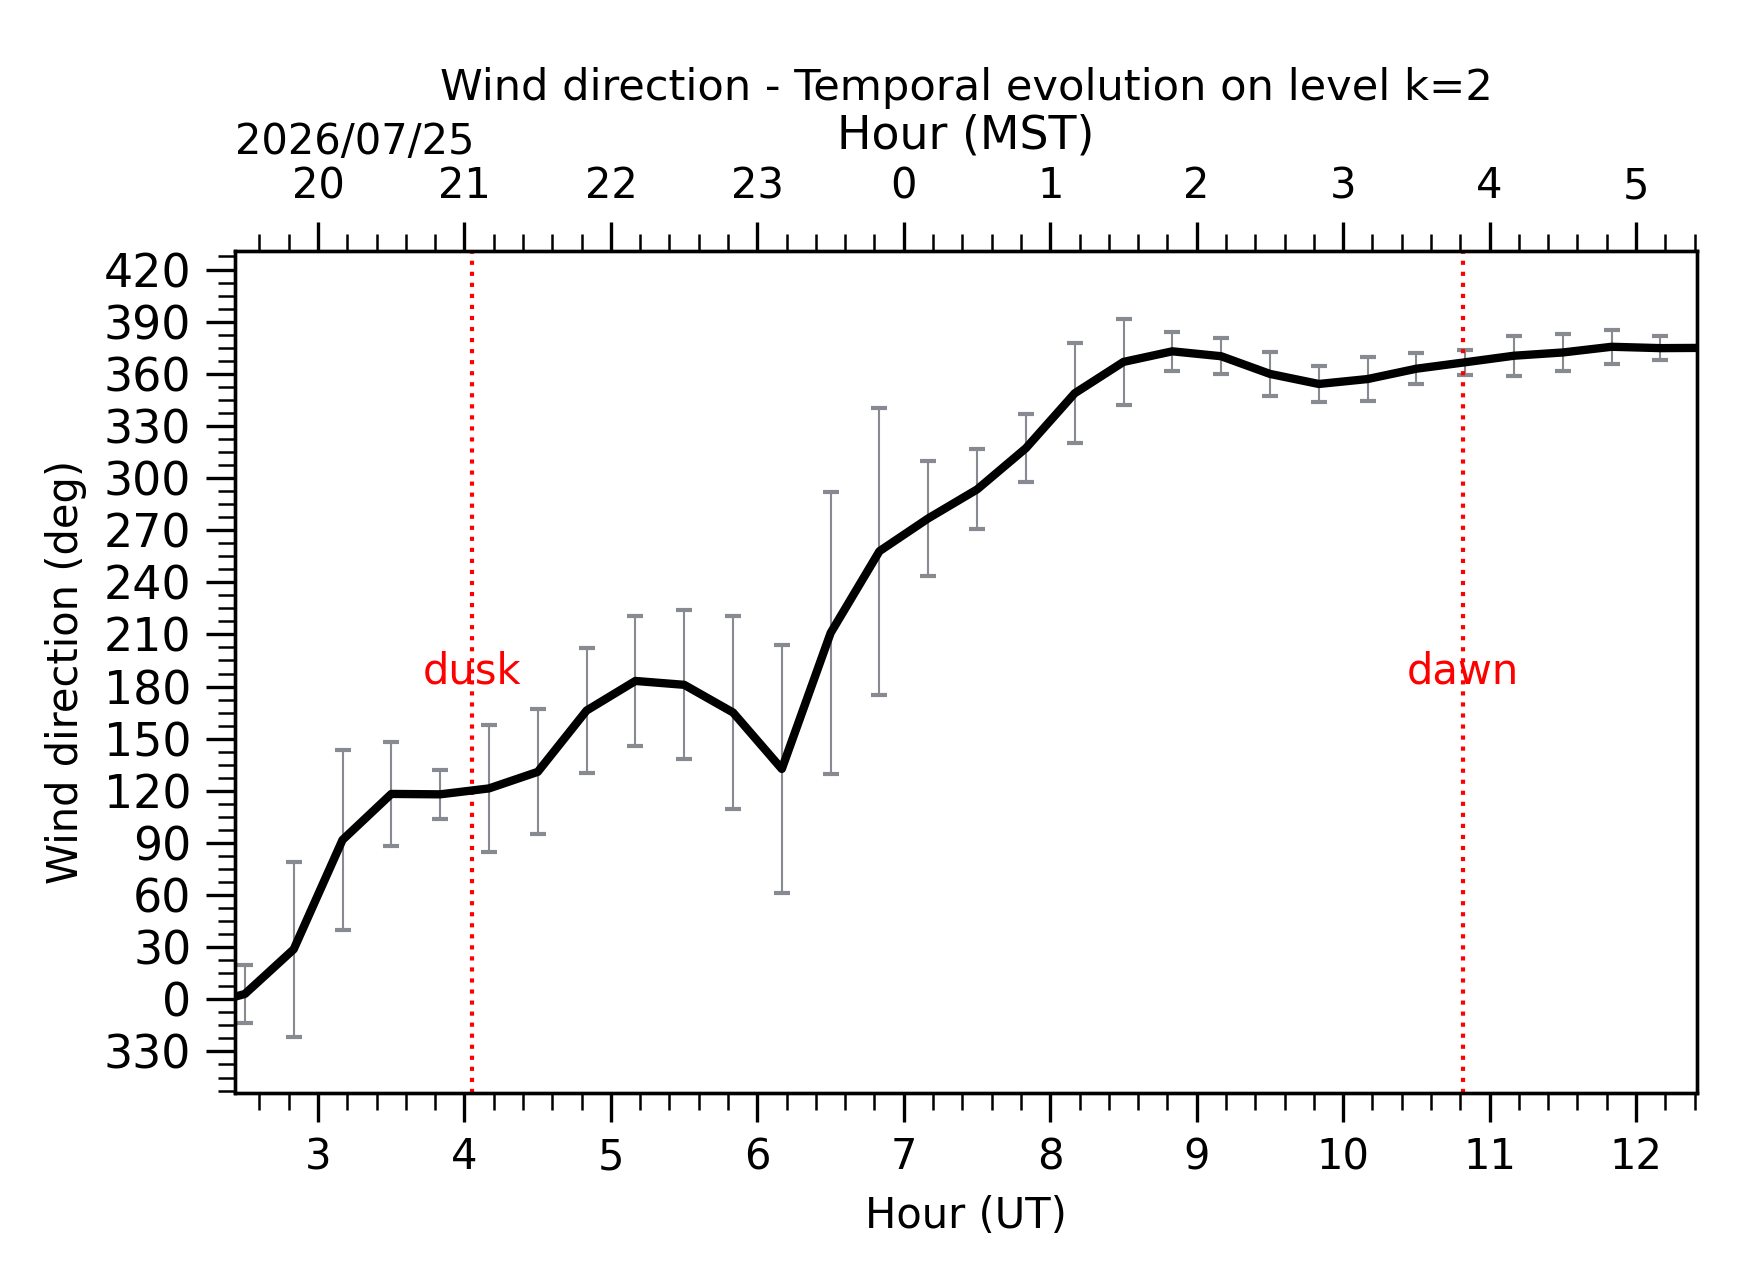
Fig. 2: Wind direction temporal evolution between the sunset and the sunrise at [0-17]m.
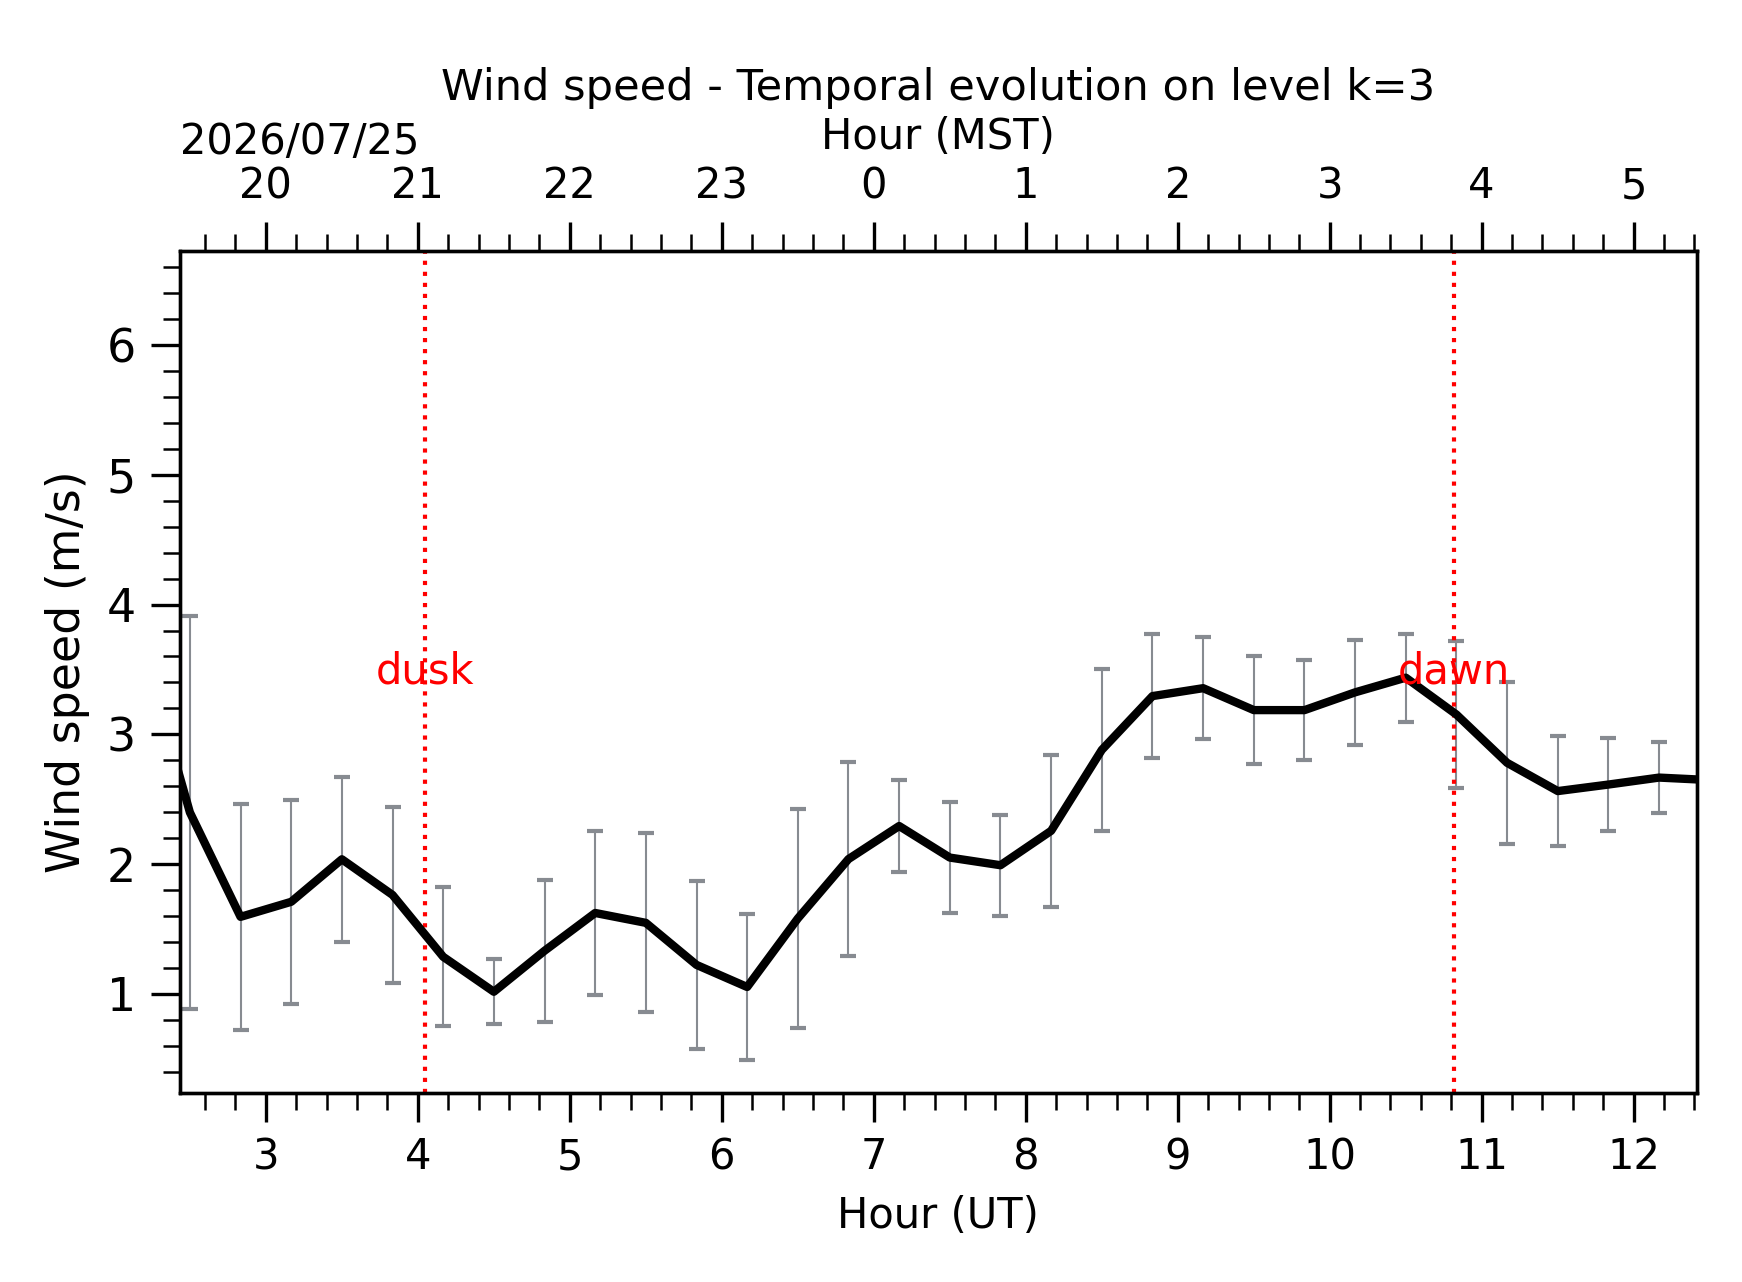
Fig. 3: Wind speed temporal evolution between the sunset and the sunrise at [17-38]m.
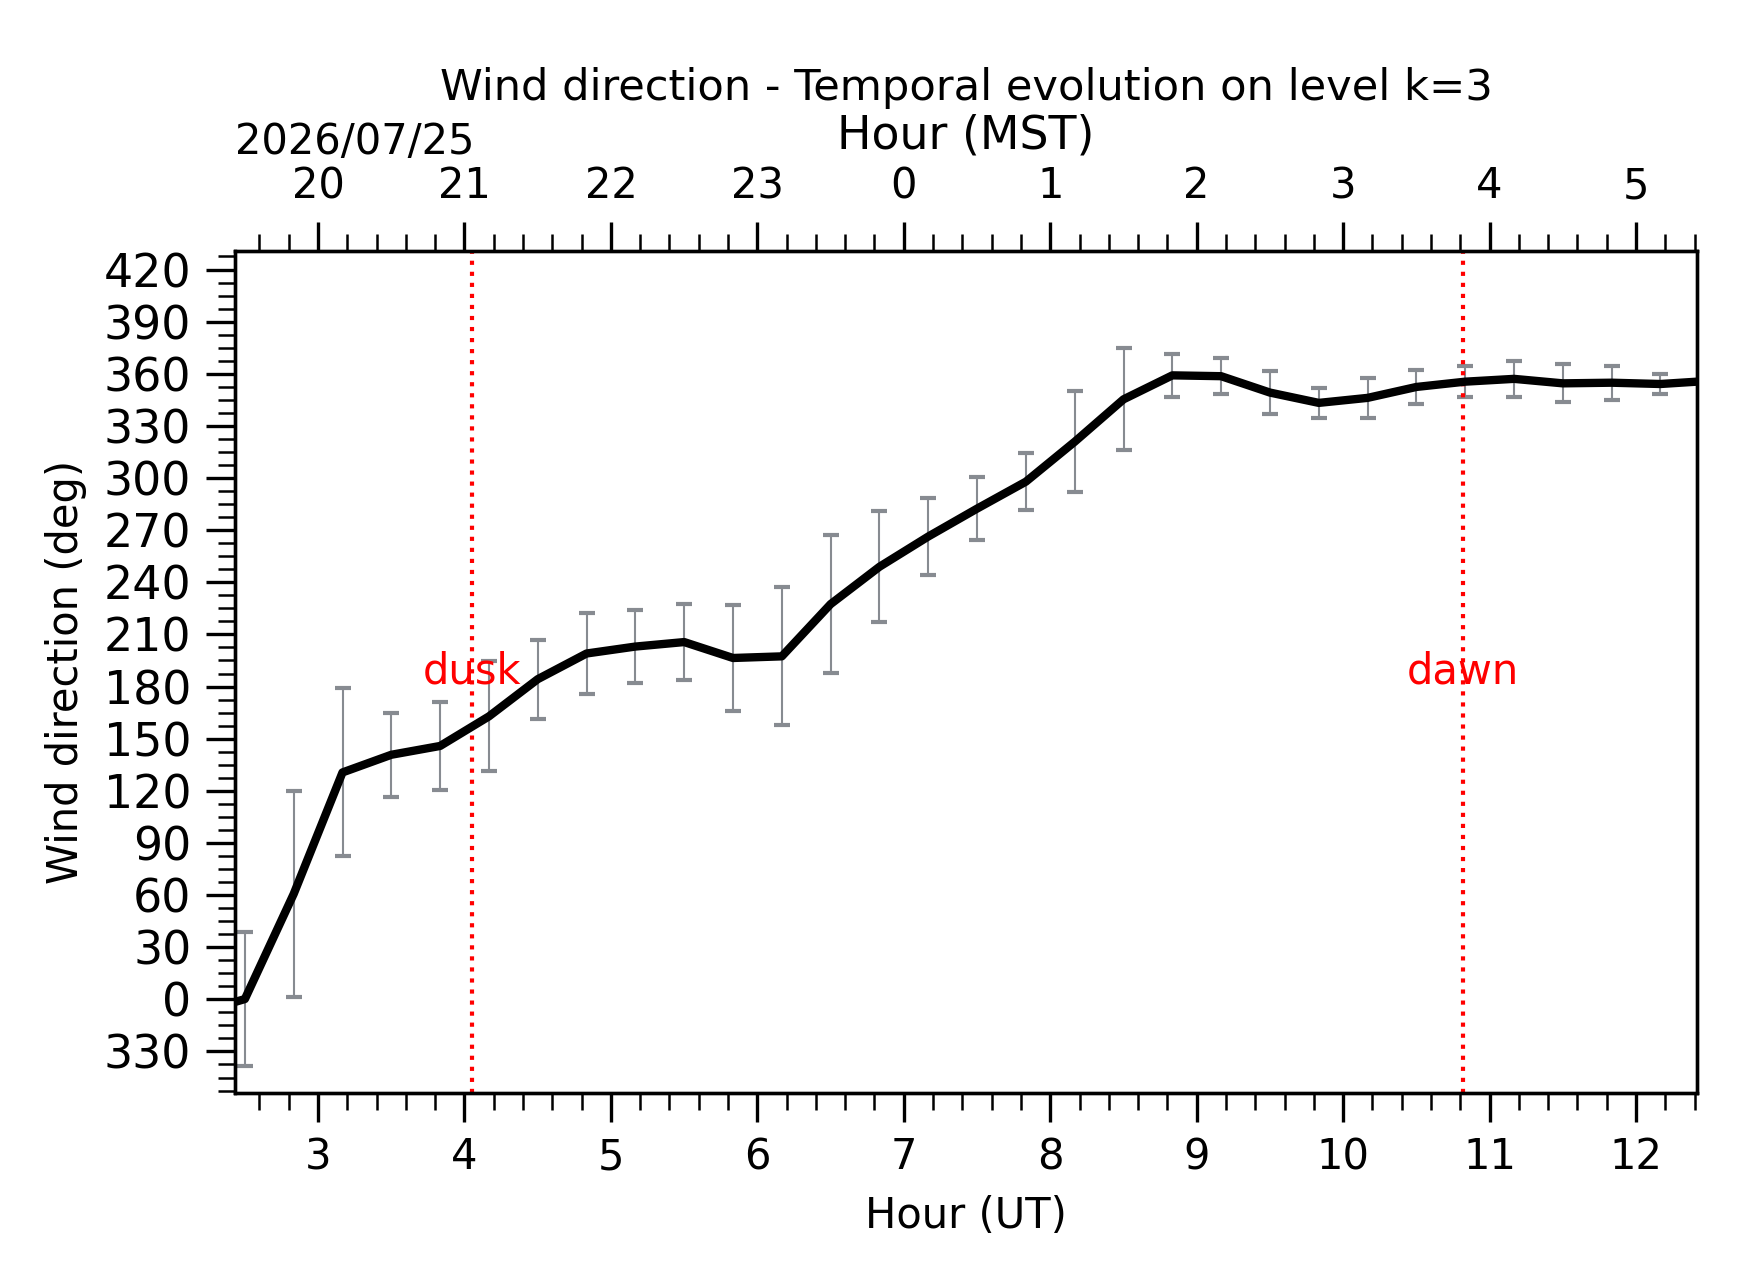
Fig. 4: Wind direction temporal evolution between the sunset and the sunrise at [17-38]m.
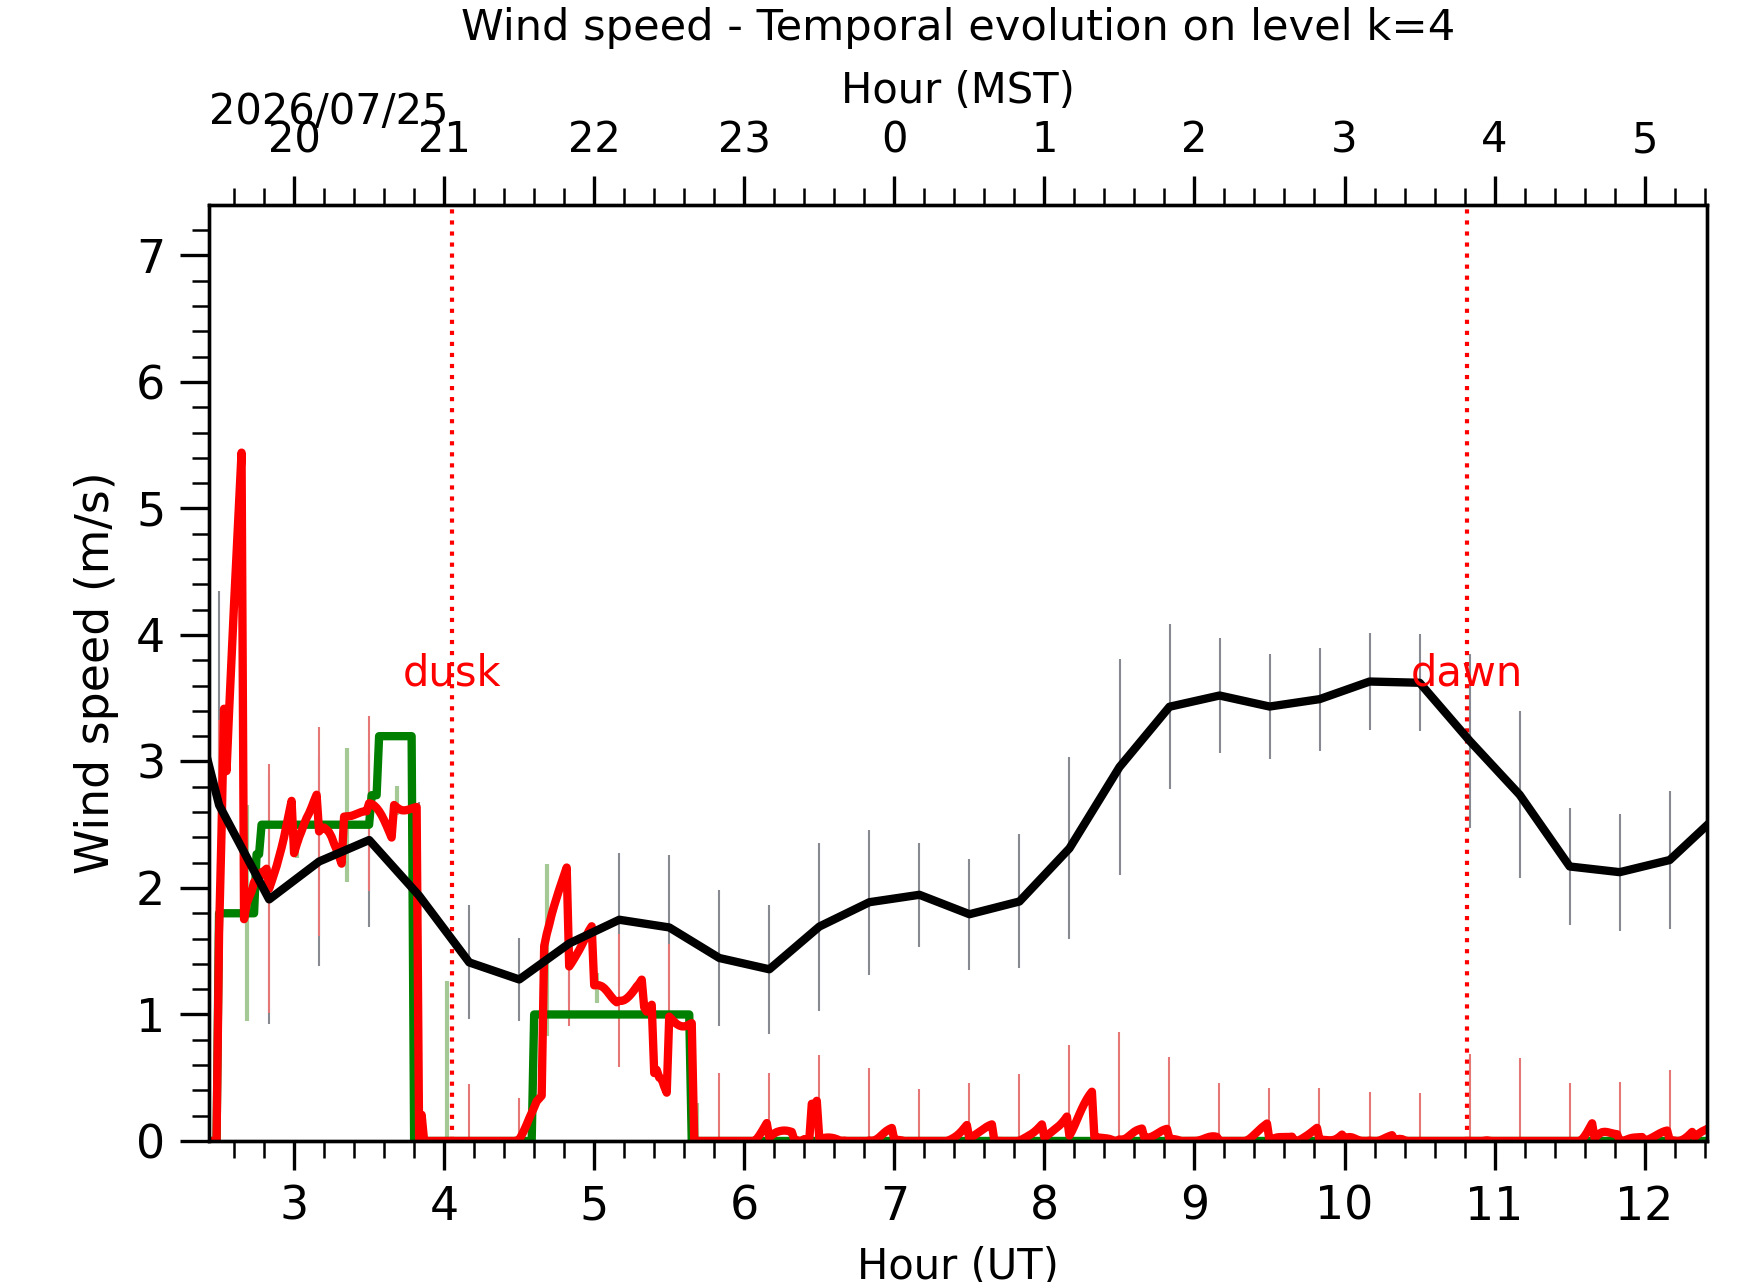
Fig. 5: Wind speed temporal evolution between the sunset and the sunrise at [38-62]m.

Fig. 6: Wind direction temporal evolution between the sunset and the sunrise at [38-62]m.