Seeing Horizontal Maps Temporal Evolution
Forecast relative to the night starting on 2026/07/25 MST
Note: click on a figure to magnify the image. Date of figures refers to the start of night in MST.
Seeing horizontal map extended on a 50km x 50km square centred on LBT (represented with a black dot). The seeing is integrated over three different vertical slabs:
TOTAL SEEING (εTOT) – [dome-20000]m
BOUNDARY LAYER SEEING (εBL) – [dome-600]m
FREE ATMOSPHERE SEEING (εFA) – [600-20000]m
The seeing in each pixel is obtained integrating the CN2 along the zenith and covering the temporal range [dusk,dawn]. The black iso-lines represent the heights of the Digital Elevation Model (DEM).
εTOT AVERAGES:
Averages are computed over the whole night [<dusk> – <dawn>] UT and also in the first, central and last part of the night (see partition).

Fig 1: εTOT over the whole night [ – ]UT time frame
Fig 1: εTOT over the whole night [ – ]UT time frame
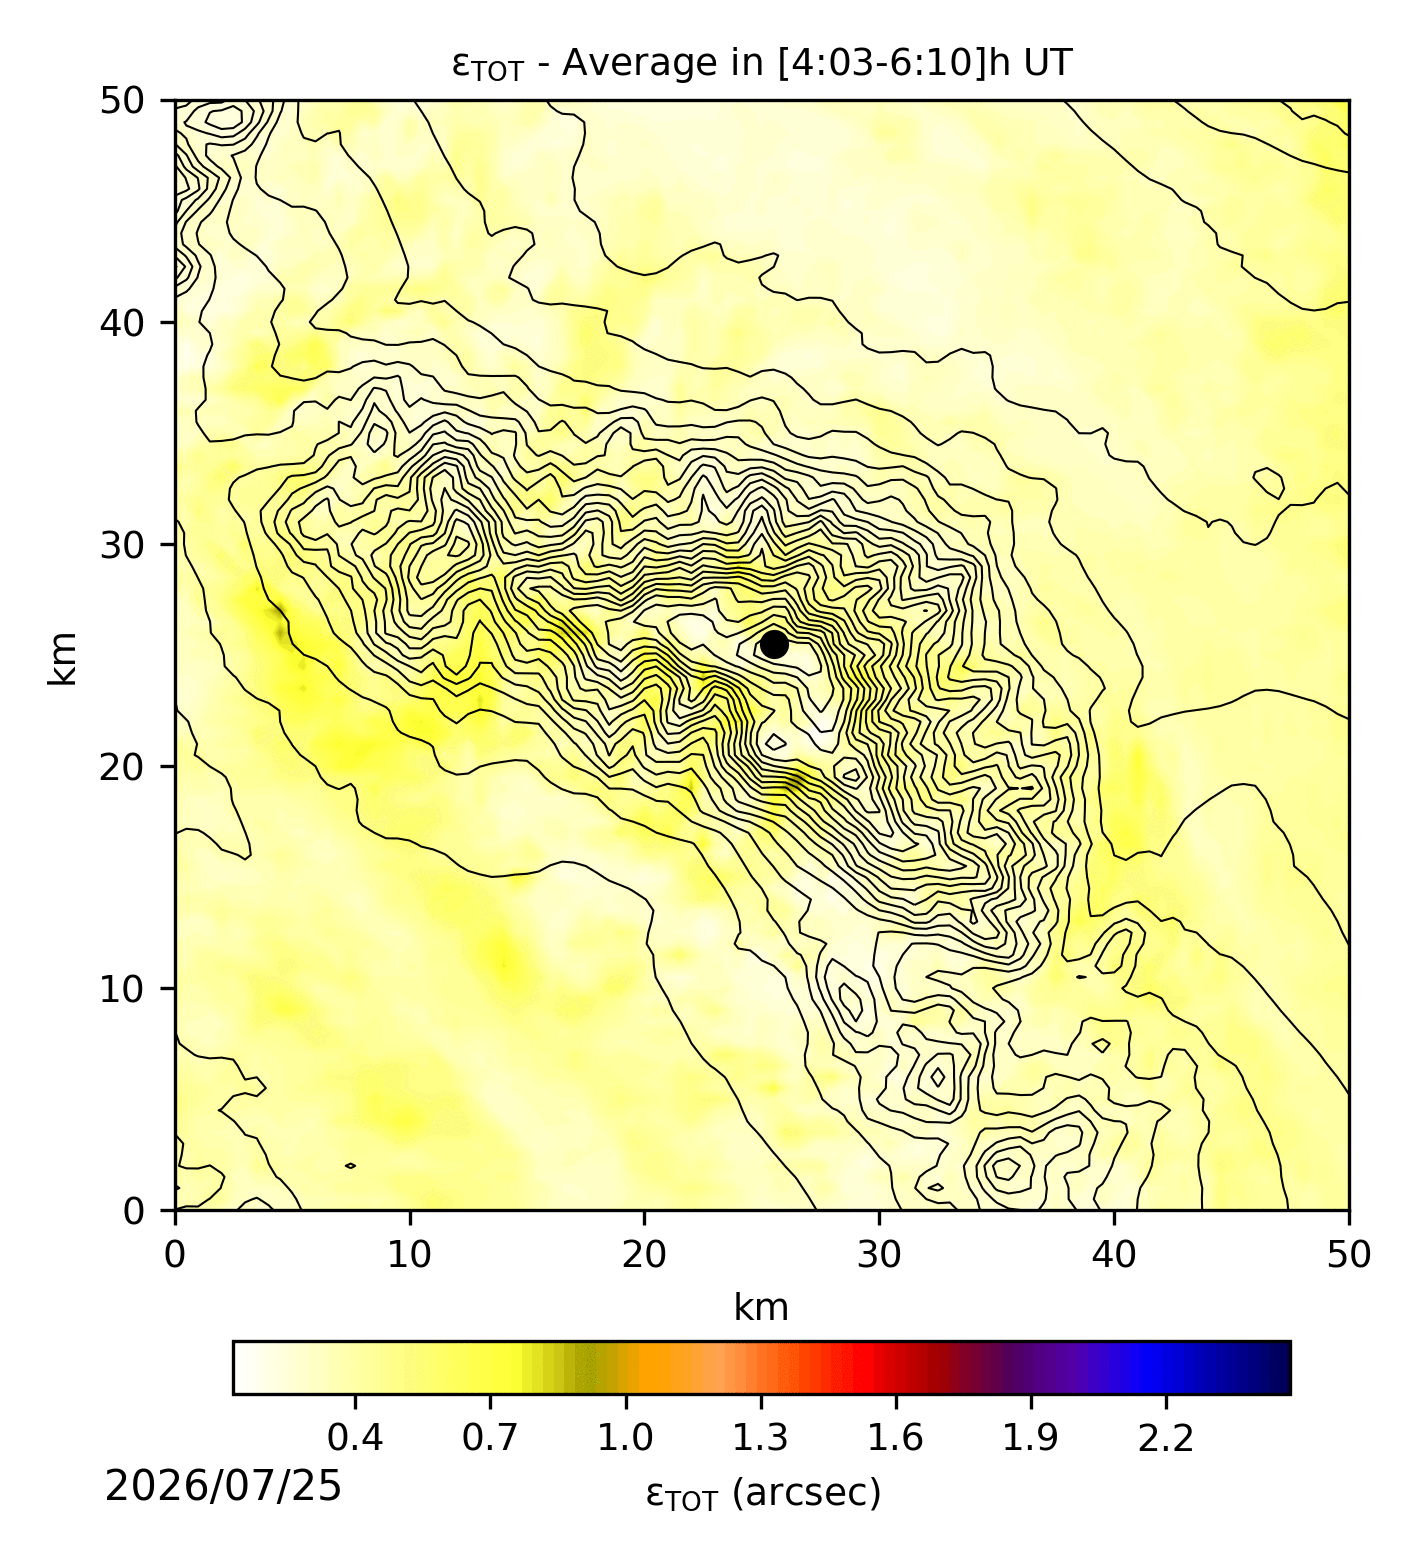
Fig. 2: εTOT over the “first part of the night”.
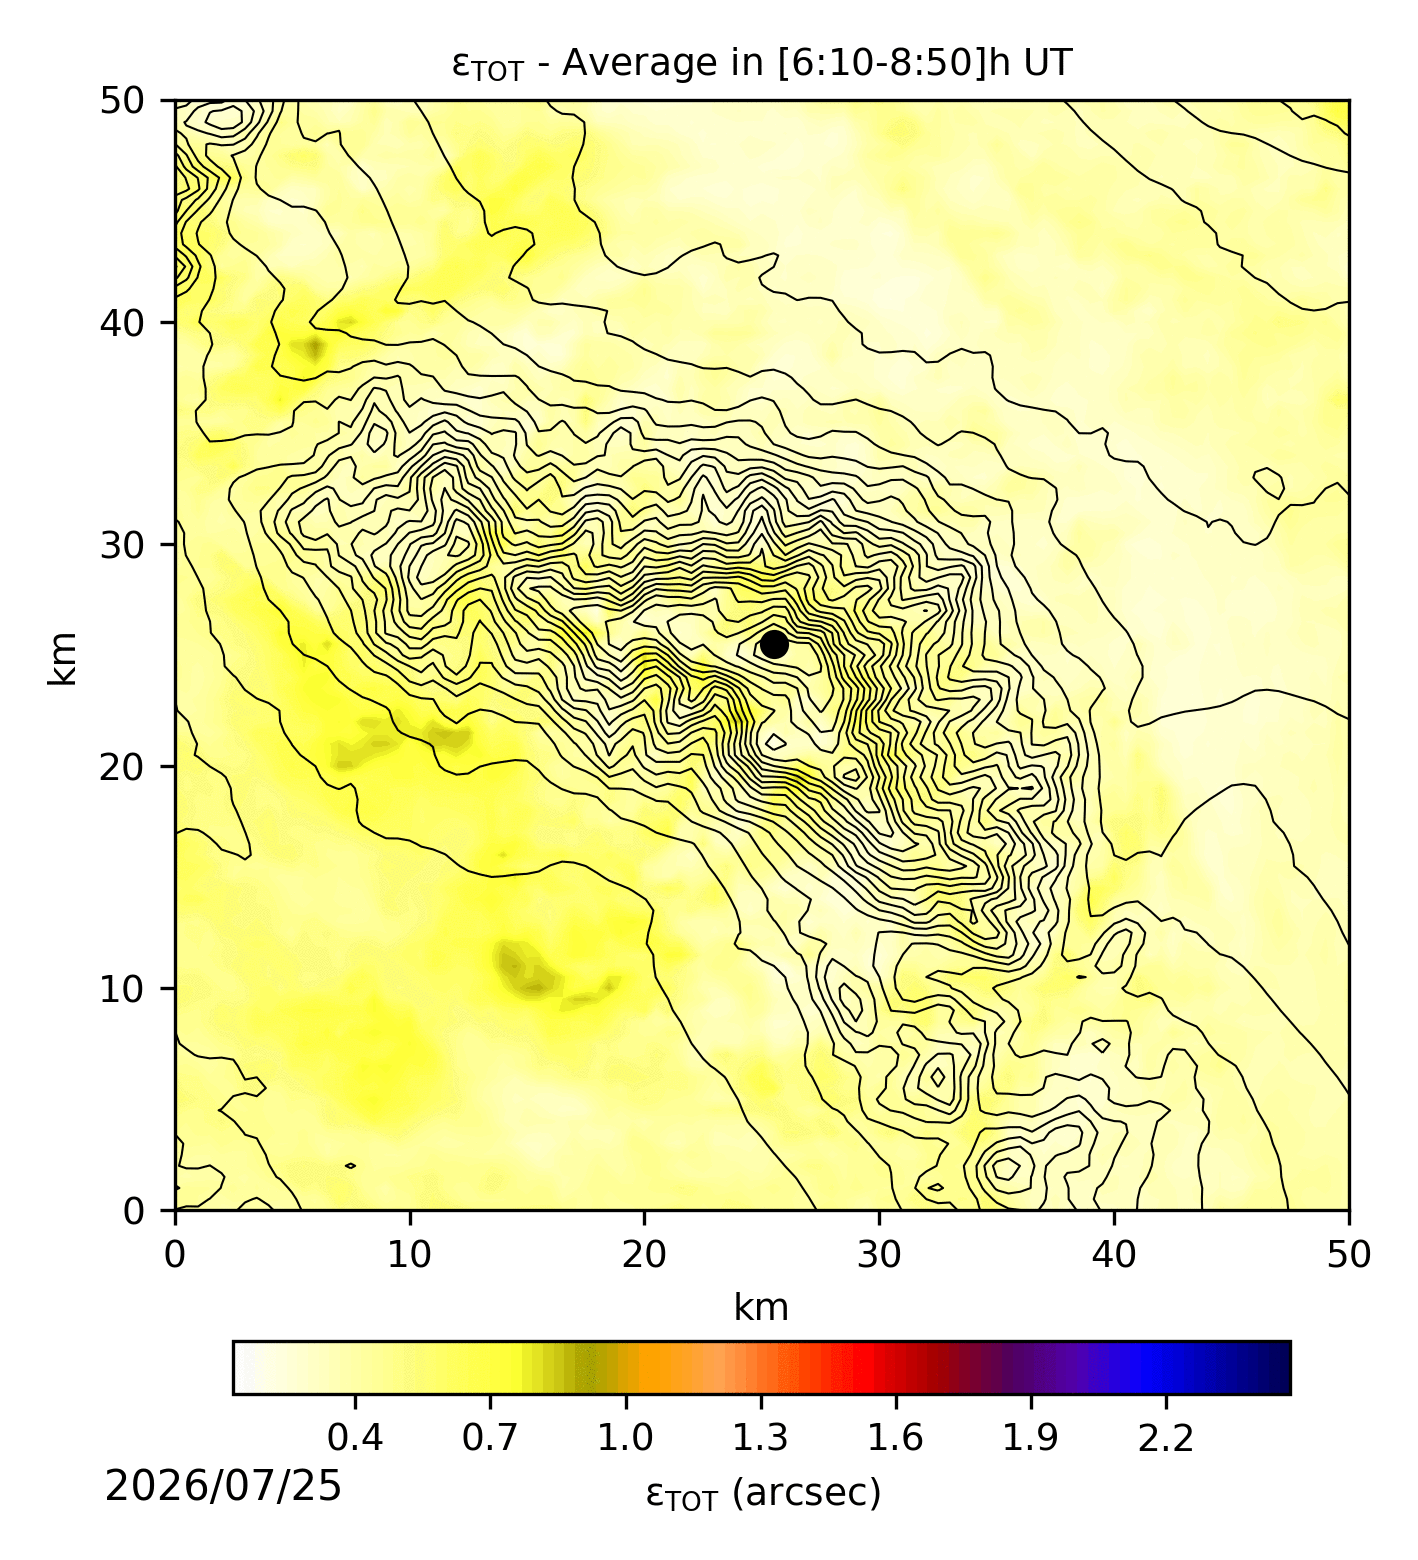
Fig. 3: εTOT over the “central part of the night”.

Fig. 4: εTOT over the “last part of the night”.
εBL AVERAGES:
Averages are computed over the whole night [<dusk> – <dawn>] UT and also in the first, central and last part of the night (see partition).
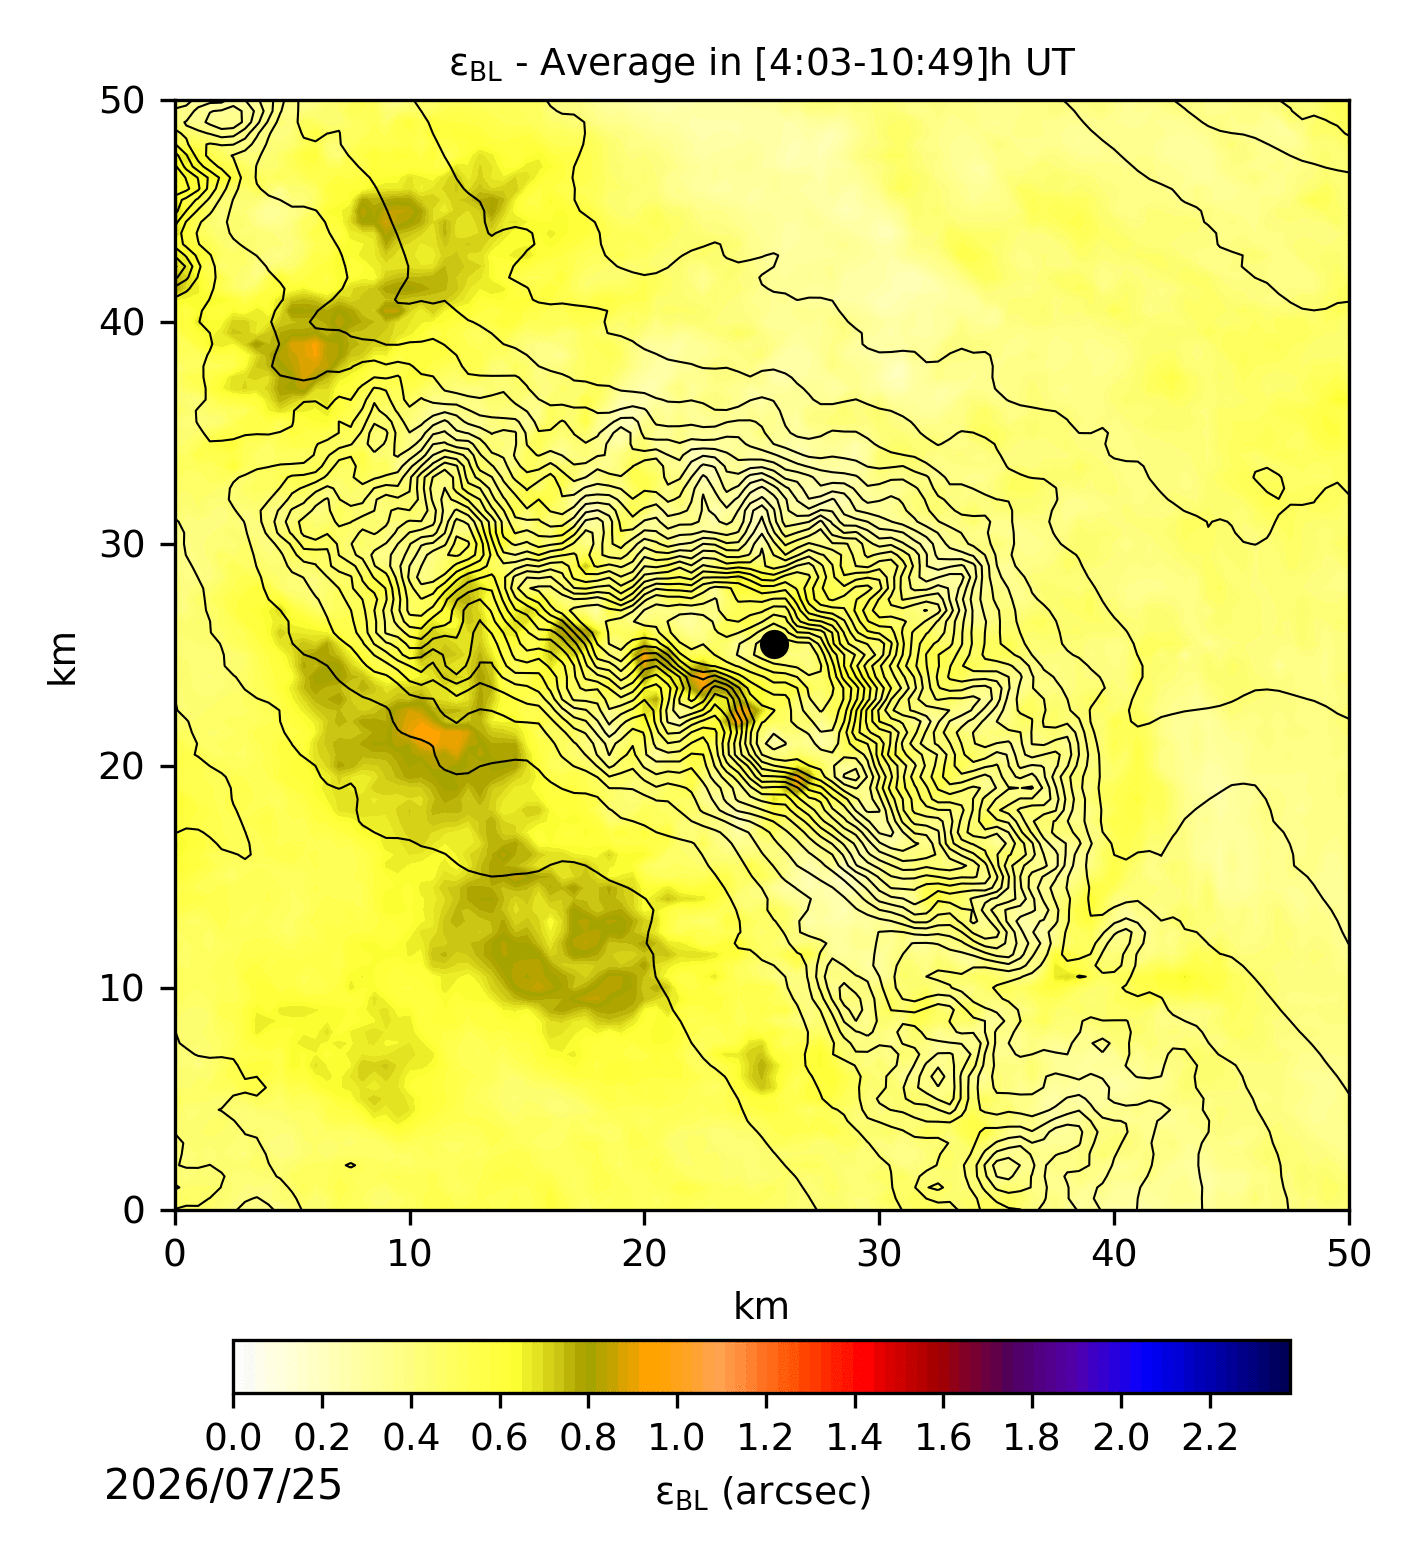
Fig. 5: εBL over the whole night [ – ]UT time frame
Fig. 5: εBL over the whole night [ – ]UT time frame

Fig. 6: εBL over the “first part of the night”.
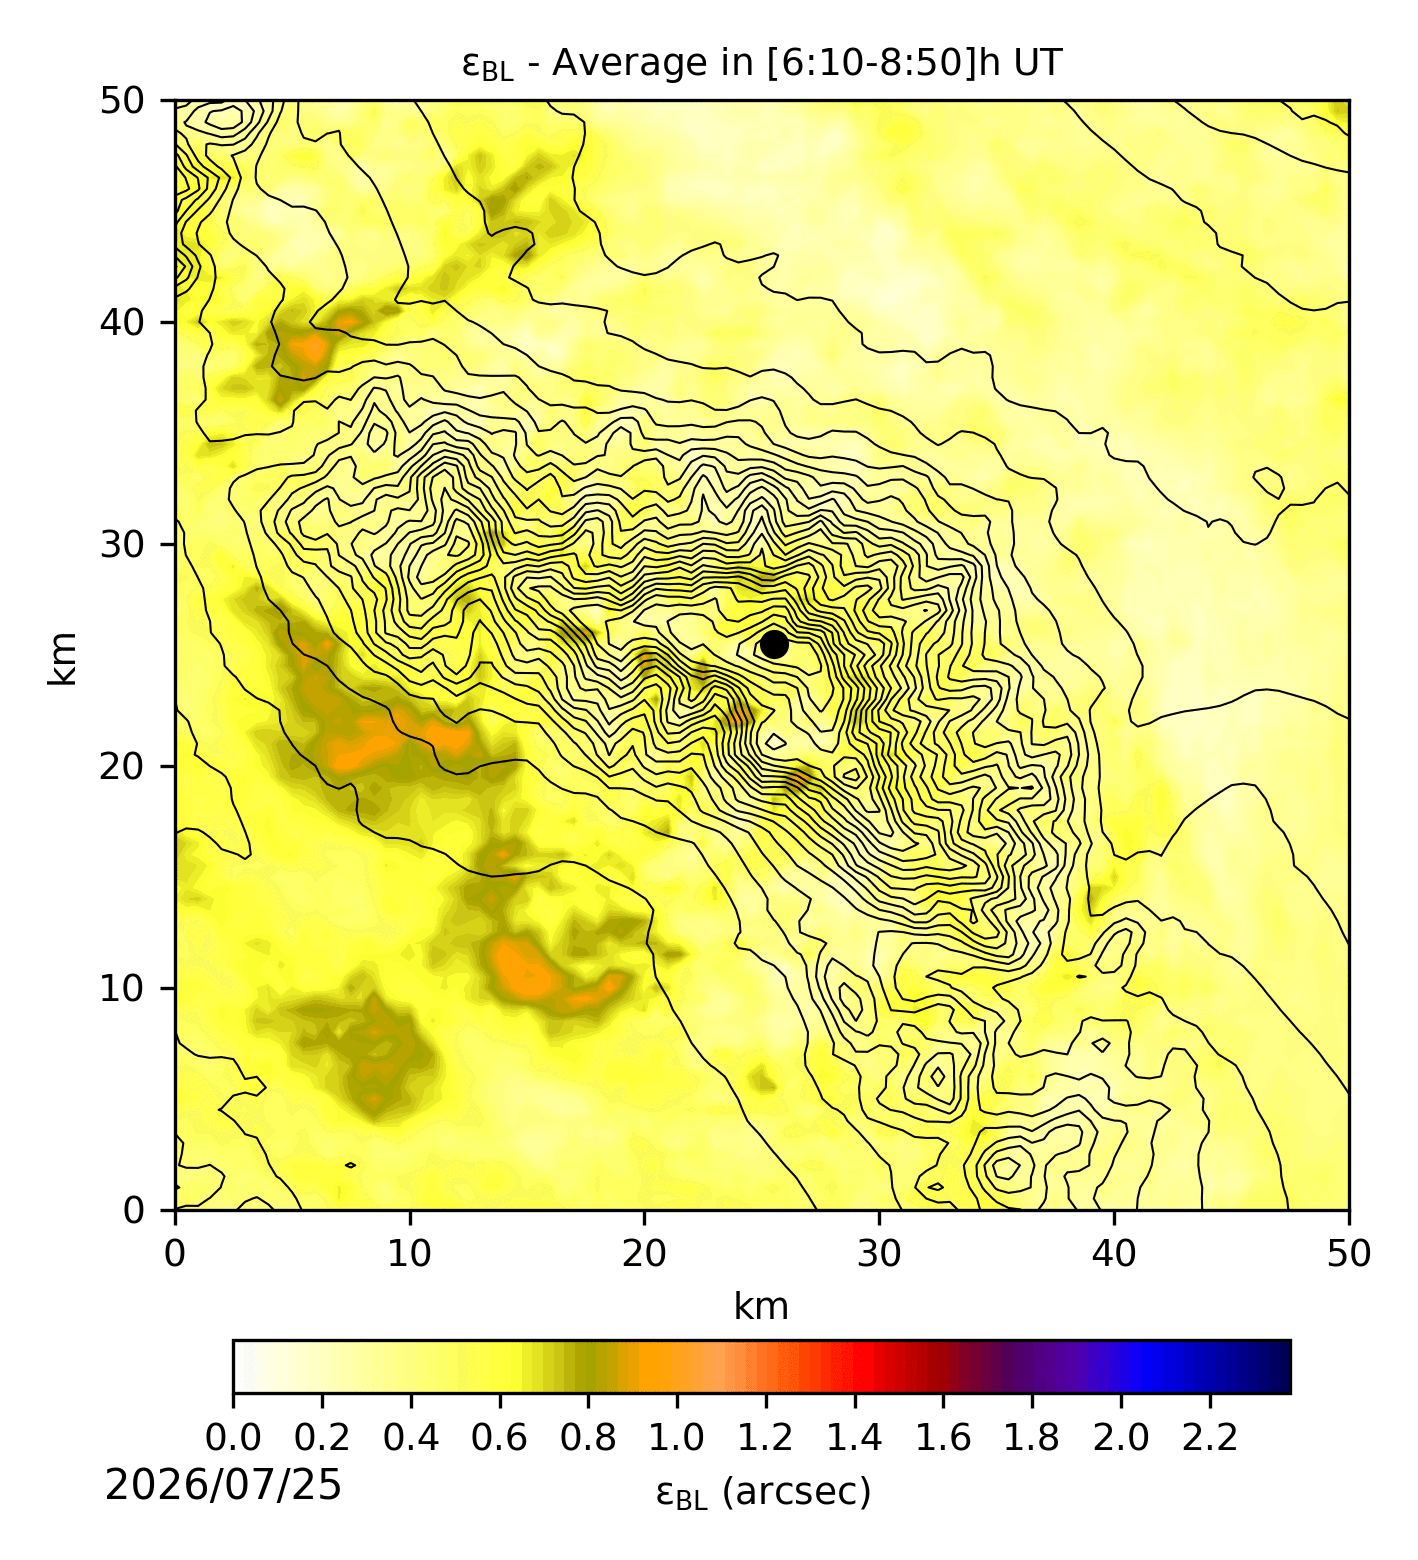
Fig. 7: εBL over the “central part of the night”.
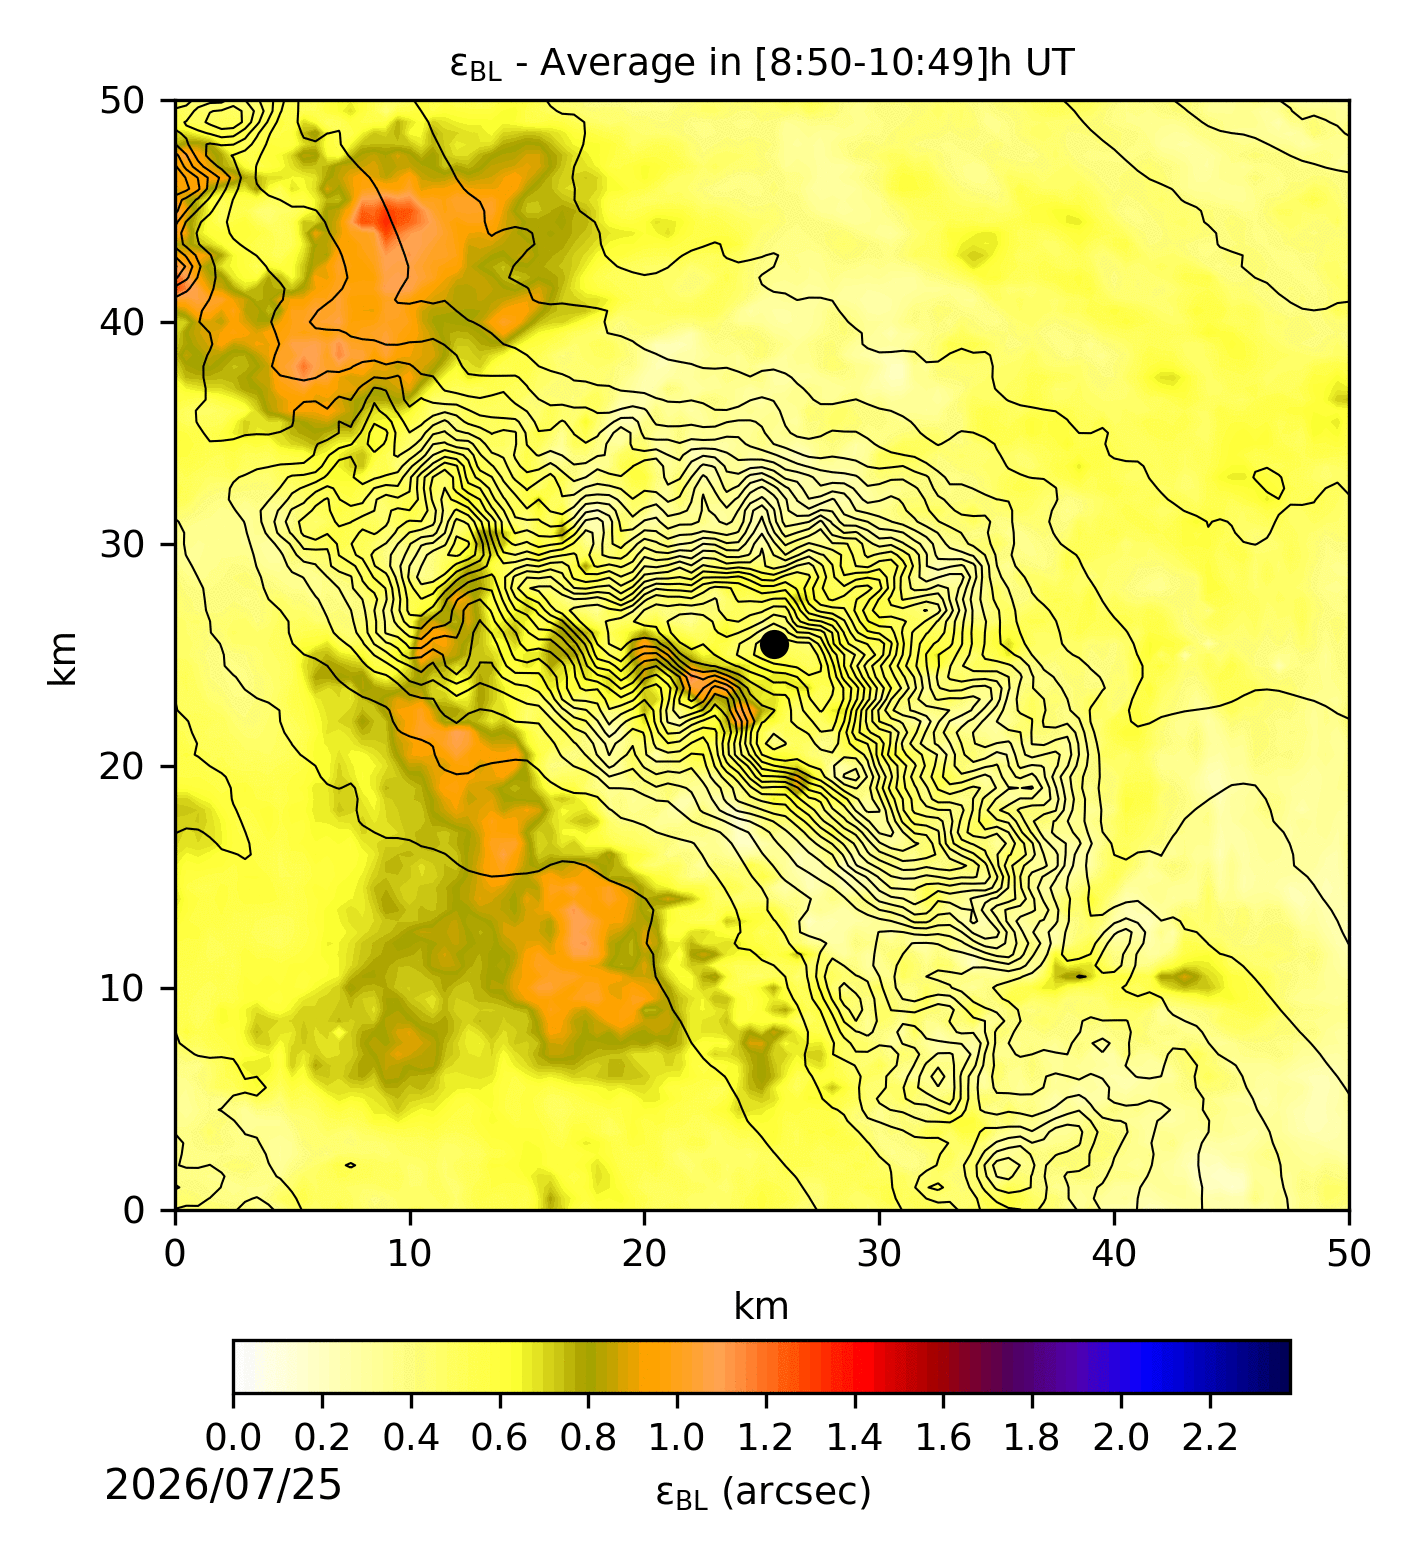
Fig. 8: εBL over the “last part of the night”.
εFA AVERAGES:
Averages are computed over the whole night [<dusk> – <dawn>] UT and also in the first, central and last part of the night (see partition).
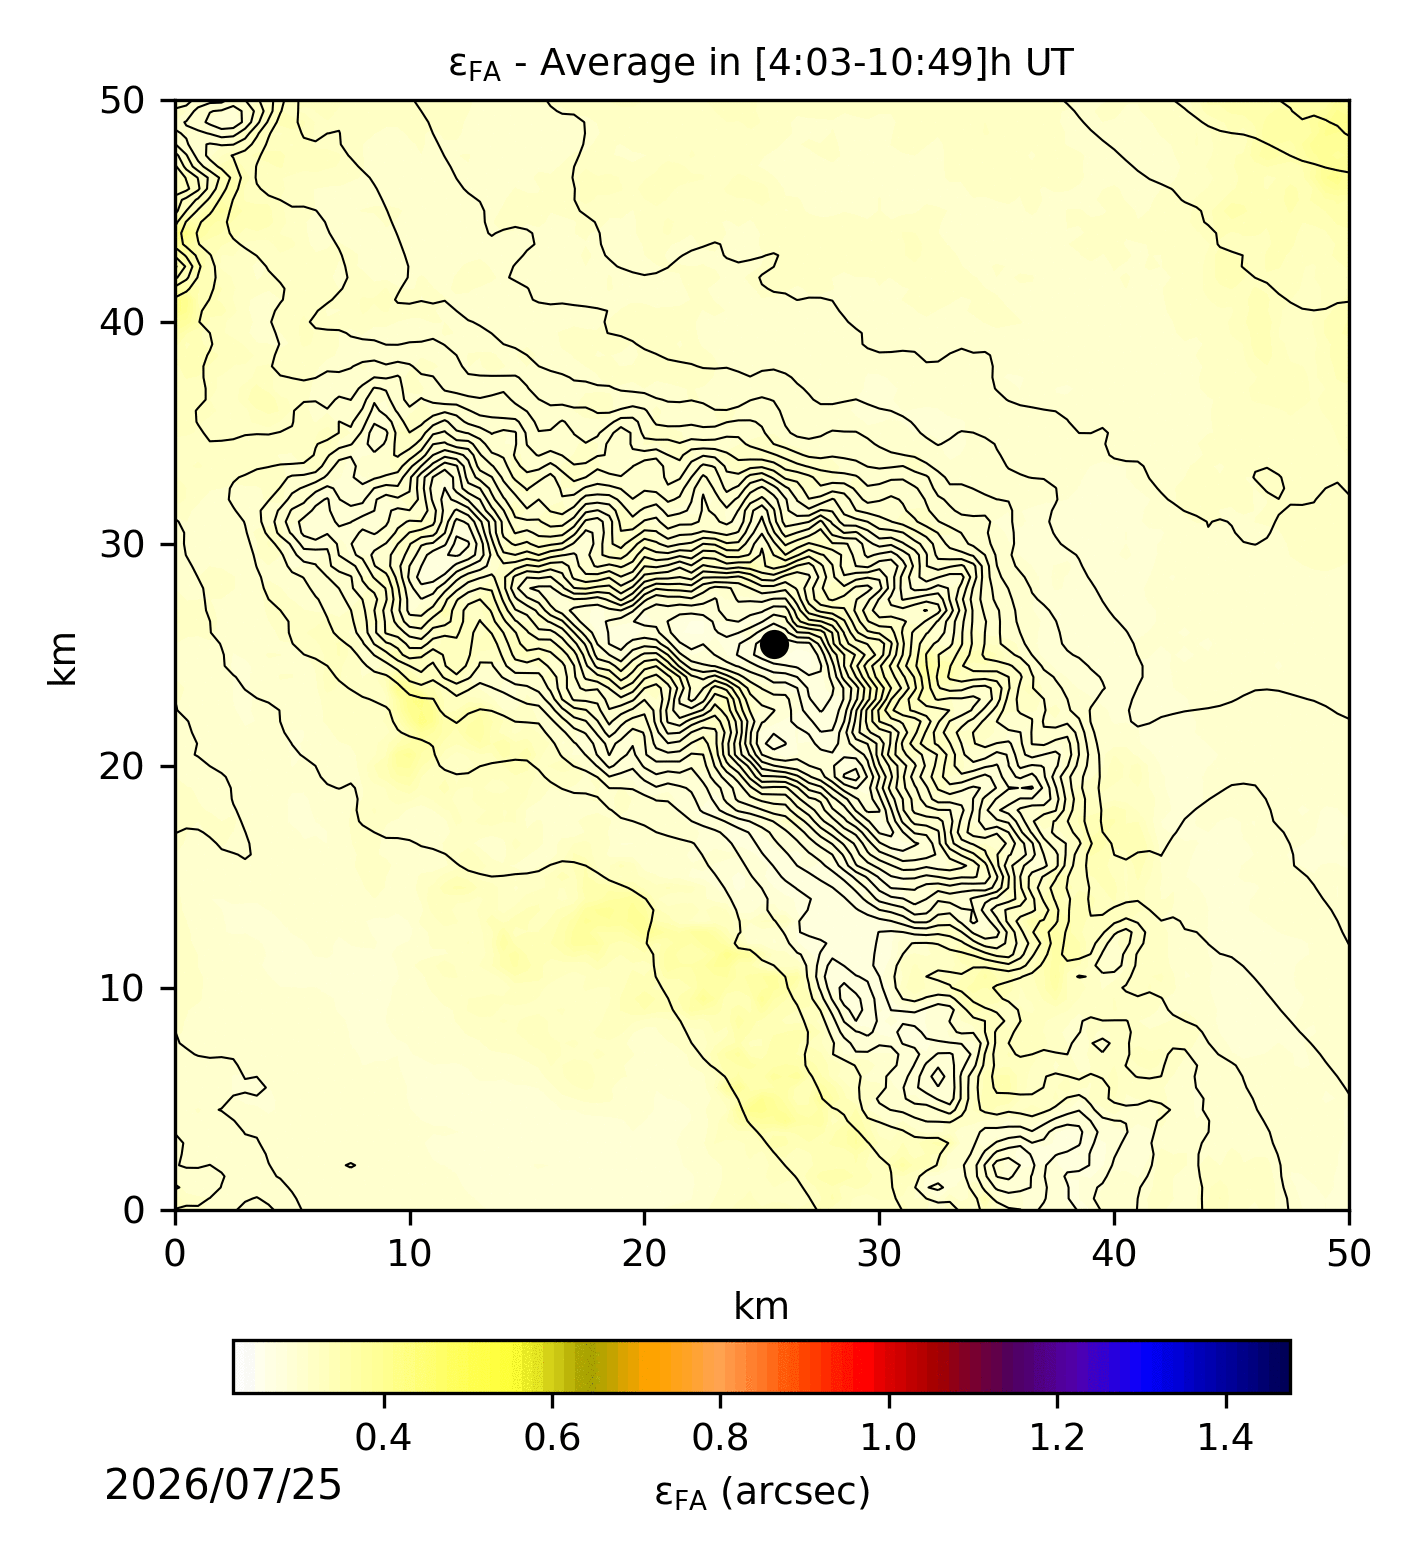
Fig. 9: εBL over the whole night [ – ]UT time frame
Fig. 9: εBL over the whole night [ – ]UT time frame

Fig. 10: εFA over the “first part of the night”.
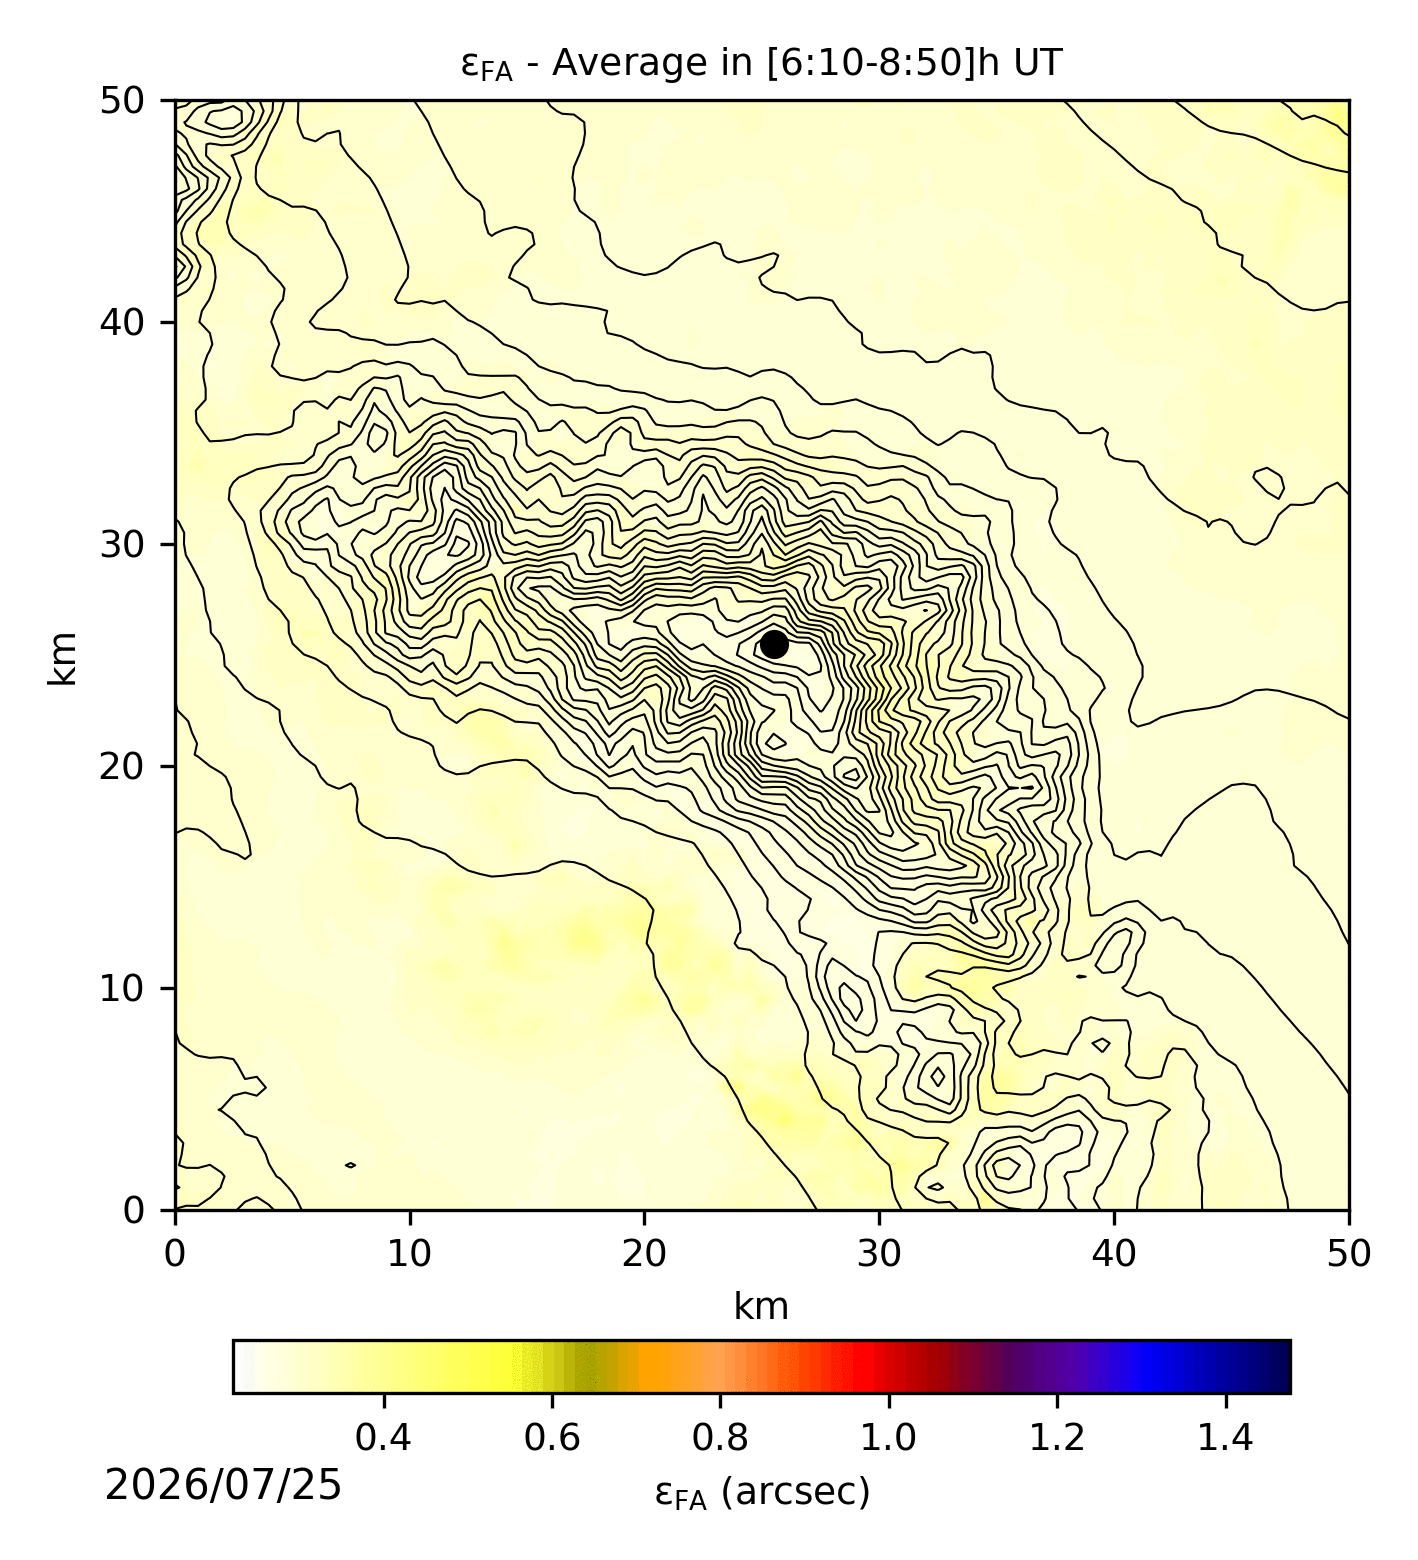
Fig. 11: εFA over the “central part of the night”.
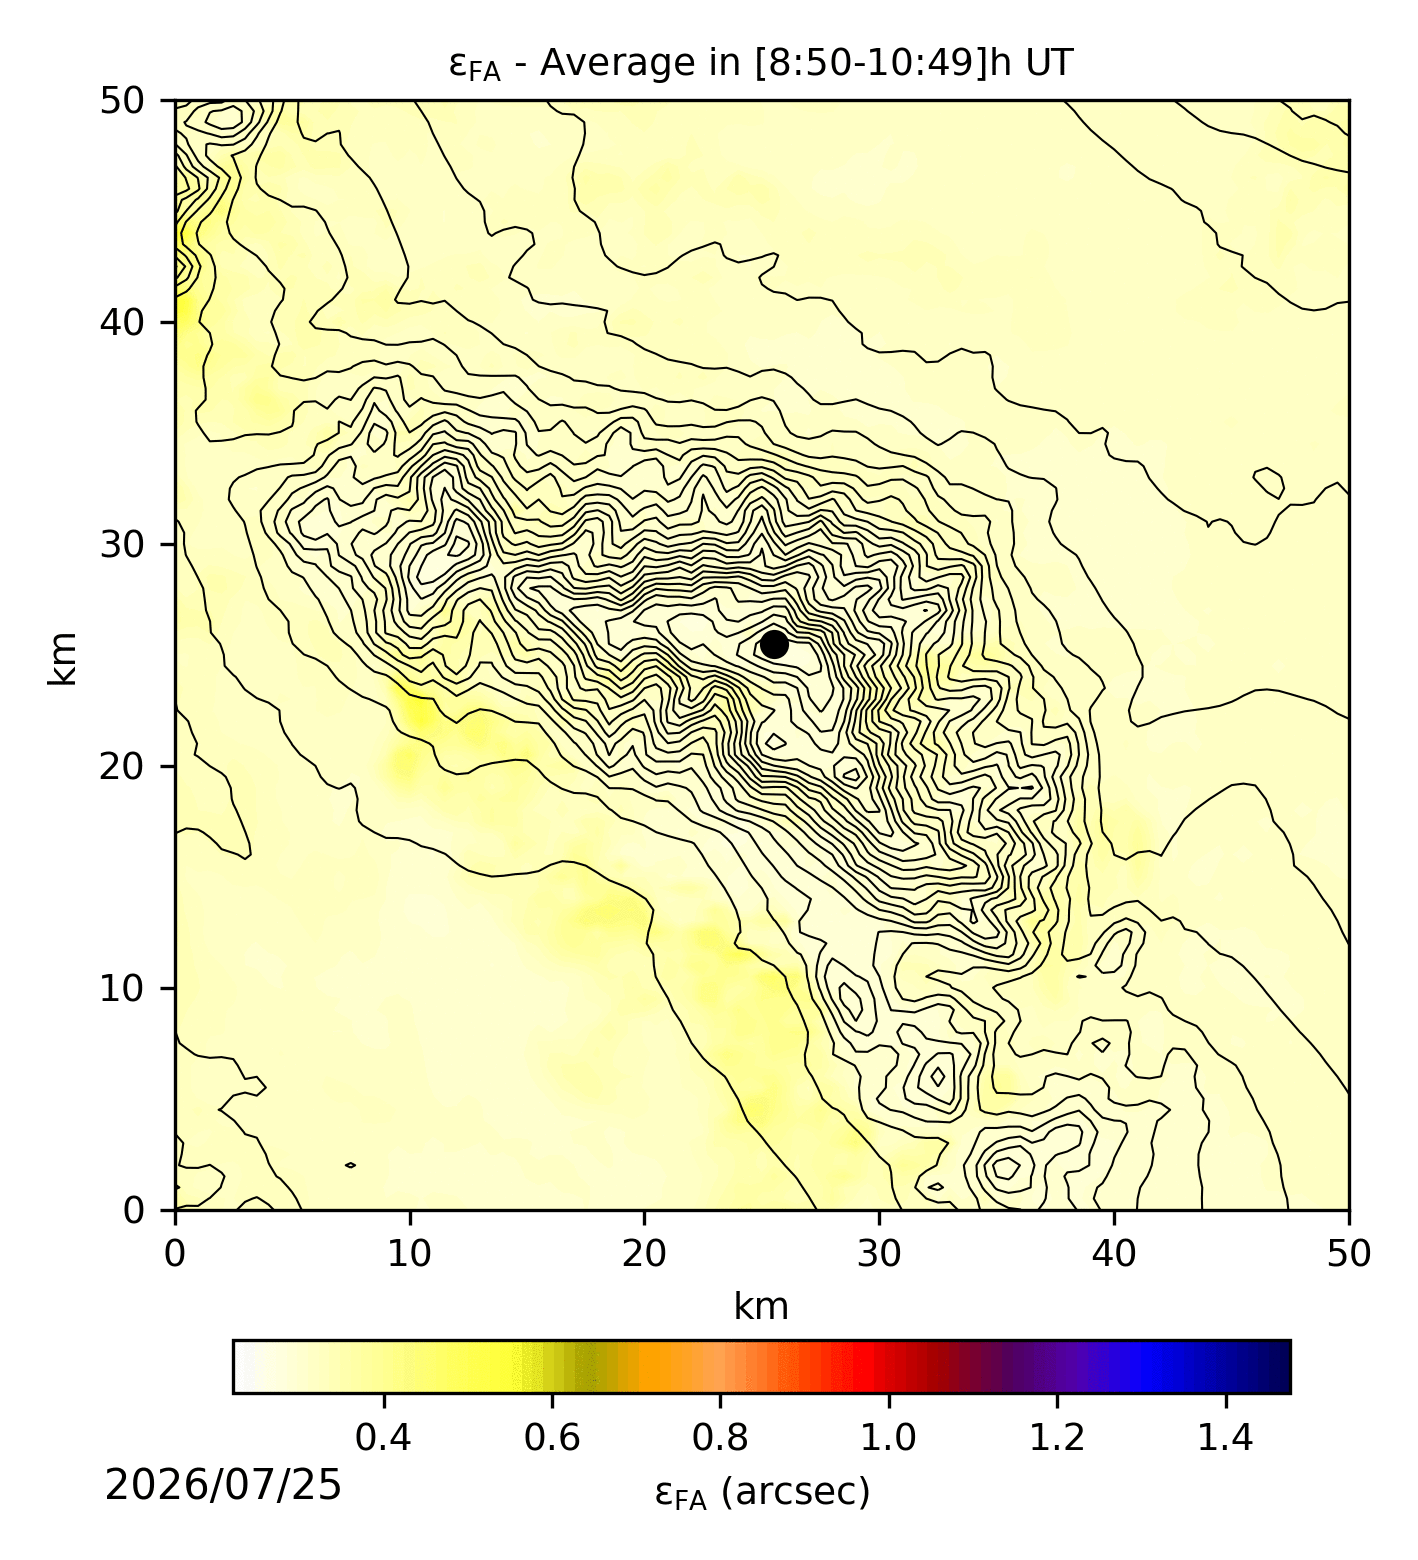
Fig. 12: εFA over the “last part of the night”.