Temperature Temporal Evolution at Ground Levels
Forecast relative to the night starting on 2026/07/25 MST
Note: click on a figure to magnify the image. Date of figures refers to the start of night in MST.
Temperature temporal evolution between the sunset and the sunrise. Temperature T is measured either in Kelvin (right scale – absolute temperature) or Celsius (left scale).
Astronomical dusk and dawn are shown too. Values are representative of the first vertical grid points of the model. Specifically three levels are represented:
Level K=2 —> 8.5m a.g.l. (representative of the [0-17]m vertical slab).
Level K=3 —> 27.5m a.g.l. (representative of the [17-38]m vertical slab).
Level K=4 —> 50m a.g.l. (representative of the [38-62]m vertical slab).
On the x-axis is time in UT (bottom), in MST (top). Raw data points frequency is equal to the model time-step (typically from a fraction of second up to a few seconds, depending on the model configuration used). Data points are re-sampled at a temporal frequency of 20 minutes after a 1-hour moving average. The error bars are the sigma over the 20 minutes sampling, computed before the moving average.
For those cases in which there are in-situ real-time measurements, the website displays the following outputs:
- BLACK LINE: model forecast displayed at 14:00 MST.
- GREEN LINE: real-time measurements treated with a 1h moving average as the forecasts.
- RED LINE: short time scale forecasts computed each full hour and extended on the successive four hours.
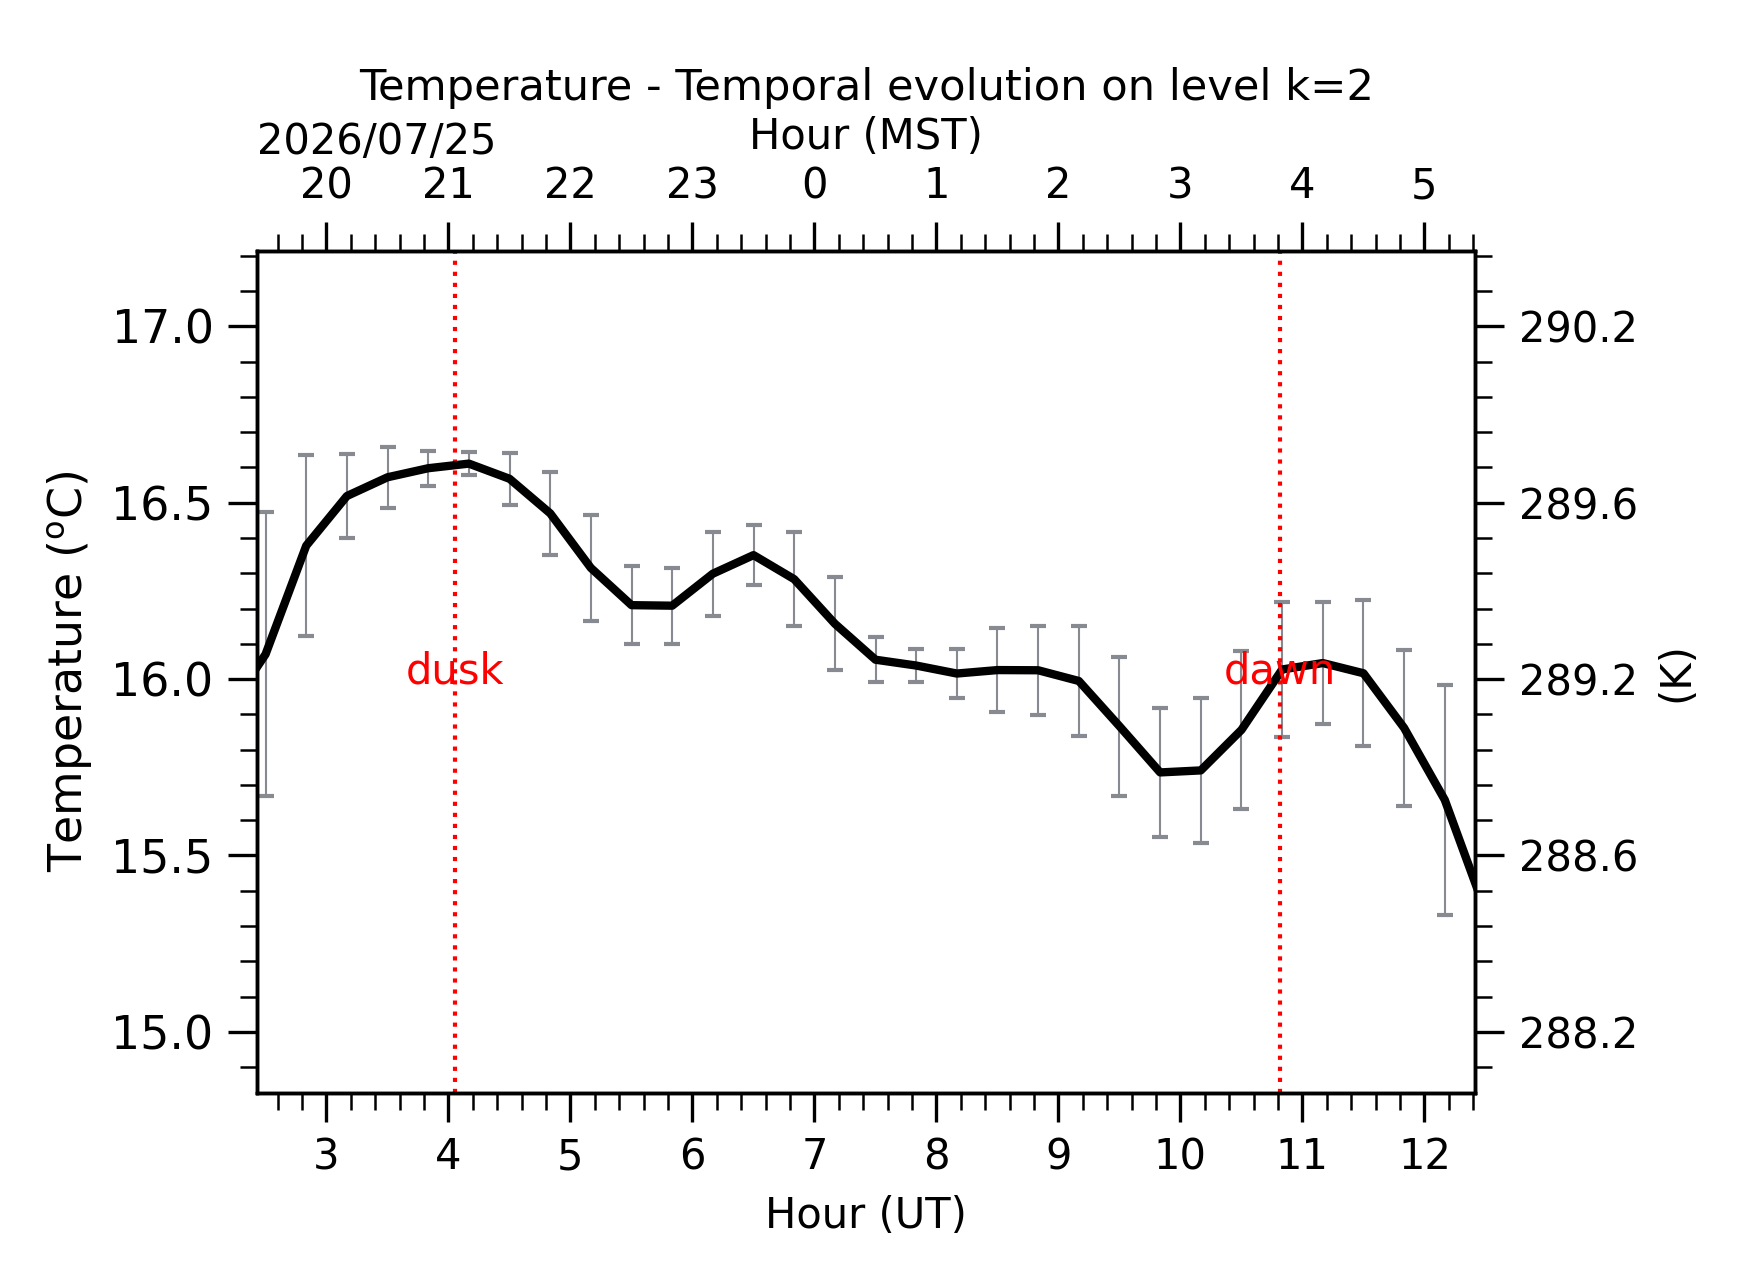
Fig. 1: Temperature temporal evolution between the sunset and the sunrise at [0-17]m.
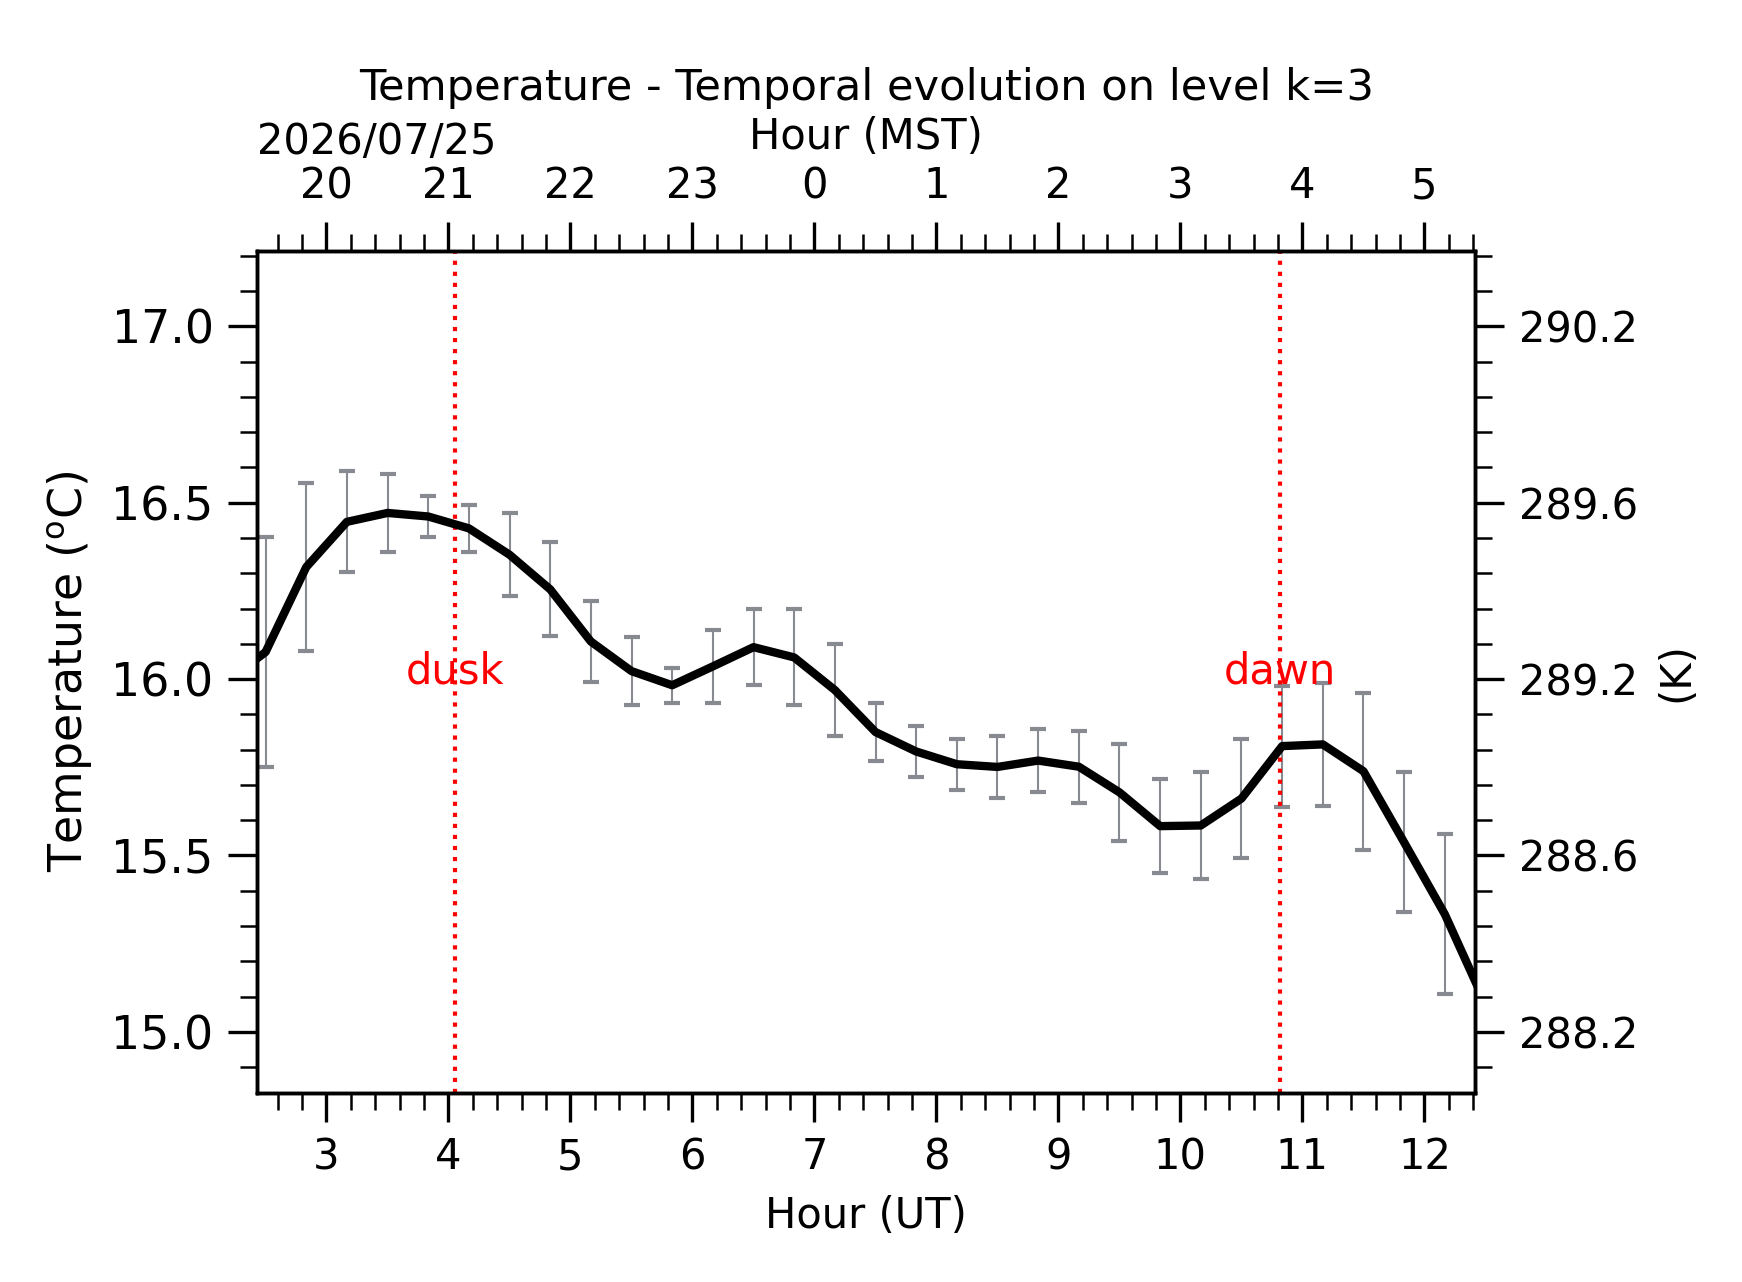
Fig. 2: Temperature temporal evolution between the sunset and the sunrise at [17-38]m.
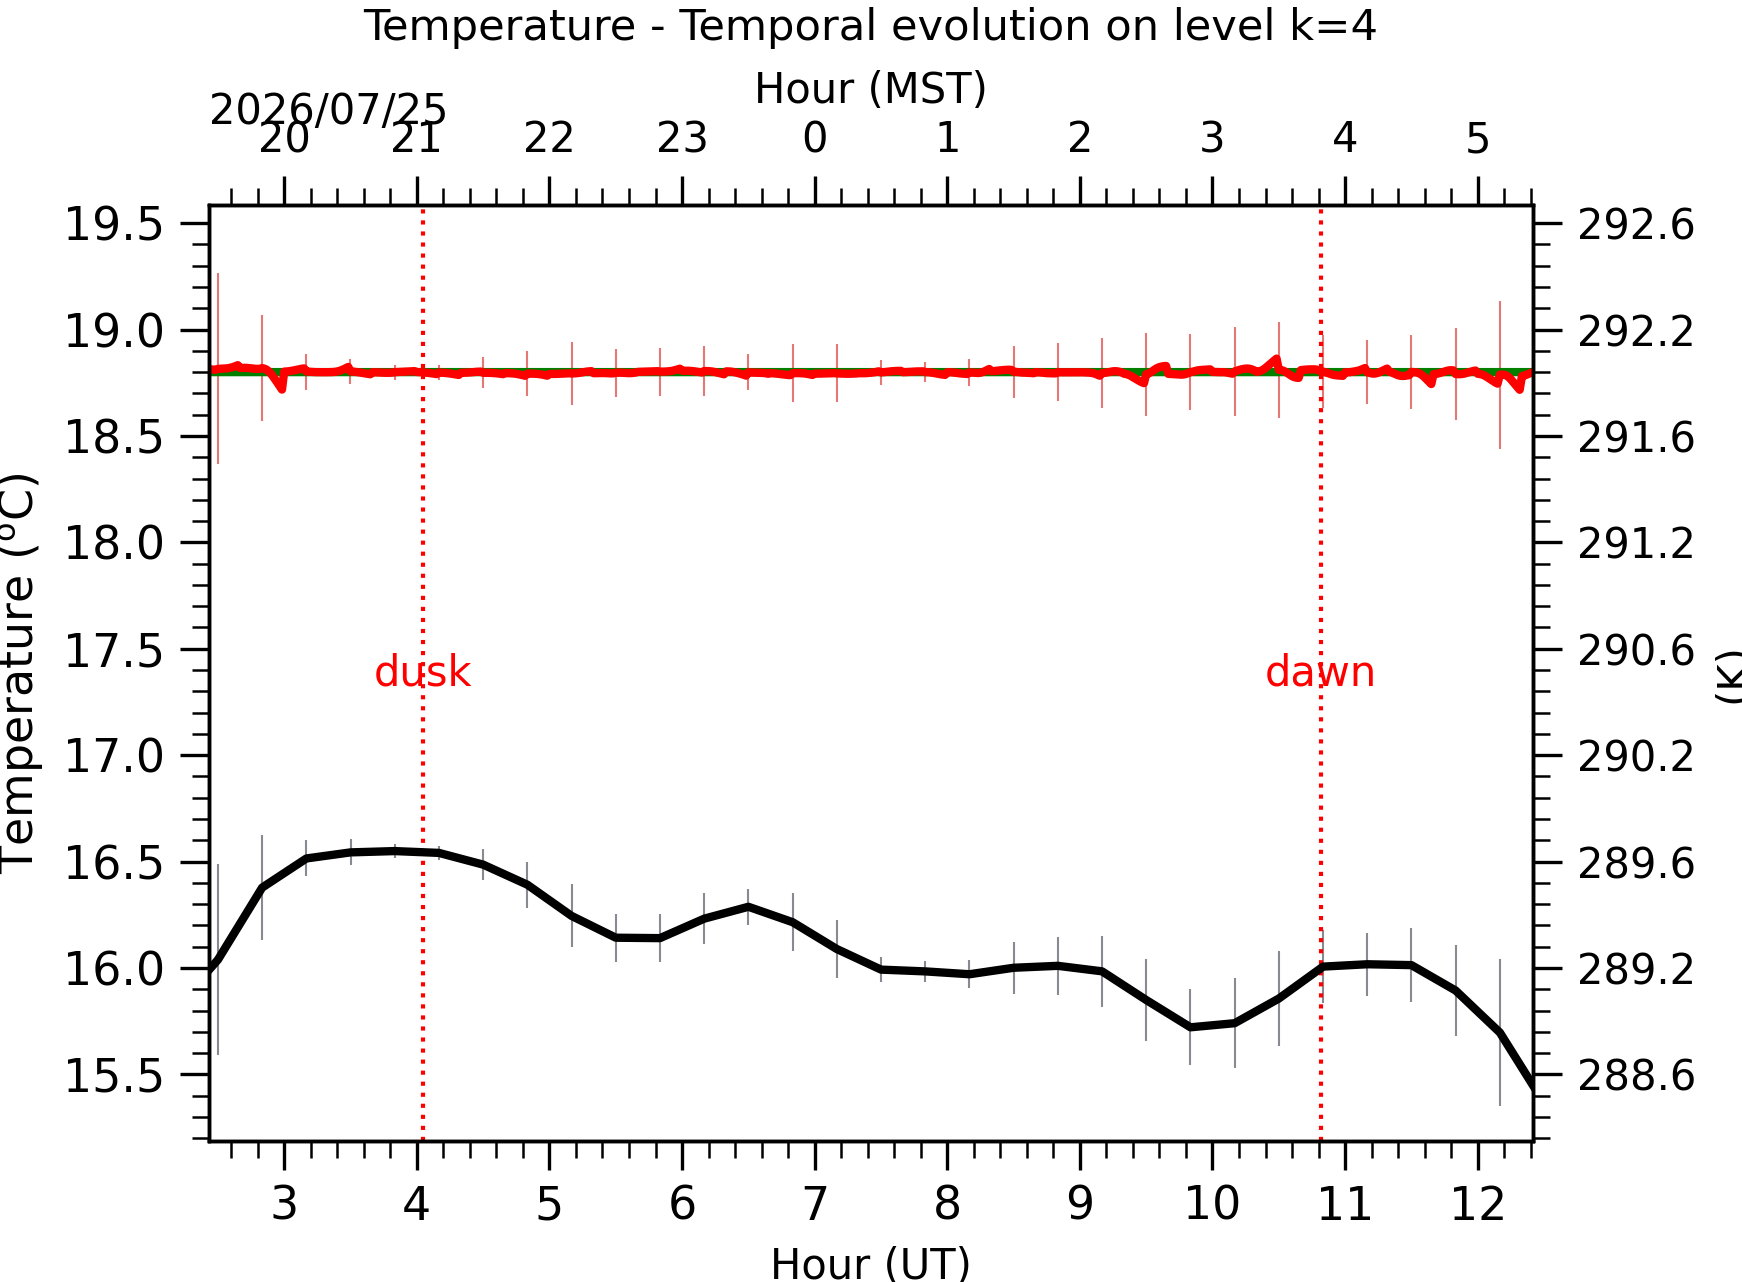
Fig. 3: Temperature temporal evolution between the sunset and the sunrise at [38-62]m.