Horizontal maps nn
Isoplanatic angle - θ0
Isoplanatic Angle (θ₀) Map
Forecast relative to the night starting on 2026/06/15 MST
Note: click on a figure to magnify the image. Date of figures refers to the start of night in MST.
Isoplanatic angle horizontal map extended on a 50km x 50km square surface centred on LBT (represented with a black dot). The isoplanatic angle in integrated in [dome-20000]m vertical slab.
The isoplanatic angle in each pixel is obtained integrating the CN2 along the zenith and covering the temporal range [dusk,dawn].
On the top left, an animation with a temporal evolution with 1-hour steps in the [dusk,dawn] time frame is shown.
On the top right, an average over the [dusk-dawn] time frame is shown.
On the bottom, isplanatic angle averages are computed over the first, central and last part of the night (see partition).
The black iso-lines represent the heights of the Digital Elevation Model (DEM).

Fig. 1: Temporal evolution of θ0,TOT ([dome-20km]) between the sunset and the sunrise.

Fig. 2: θ0 map averaged on [20-20000]m vertical slab
over the whole night time frame

Fig. 3: θ0 map averaged on [20-20000]m vertical slab over the “first part of the night”.

Fig. 4: θ0 map averaged on [20-20000]m vertical slab over the “central part of the night”.
Fig. 5: θ0 map averaged on [20-20000]m vertical slab over the “last part of the night”.
isoplantic angle nn
Isoplanatic angle - θ0
Isoplanatic Angle (θ₀) Temporal Evolution
Forecast relative to the night starting on 2026/06/15 MST
Note: click on a figure to magnify the image. Date of figures refers to the start of night in MST.
Temporal evolution of the isoplanatic angle integrated in [dome-20000]m between the sunset and the sunrise:
TOTAL ISOPLANATIC ANGLE (θ0,TOT) – [dome-20000]m
Astronomical dusk and dawn are shown too.
On the x-axis is time in UT (bottom), in MST (top). Mountain Standard Time MST=UT-7. Data points frequency is 2 minutes. Data points are re-sampled at a frequency of 20 minutes after a 1-hour moving average. The error bars are the sigma over the 20 minutes sampling, computed before the moving average.
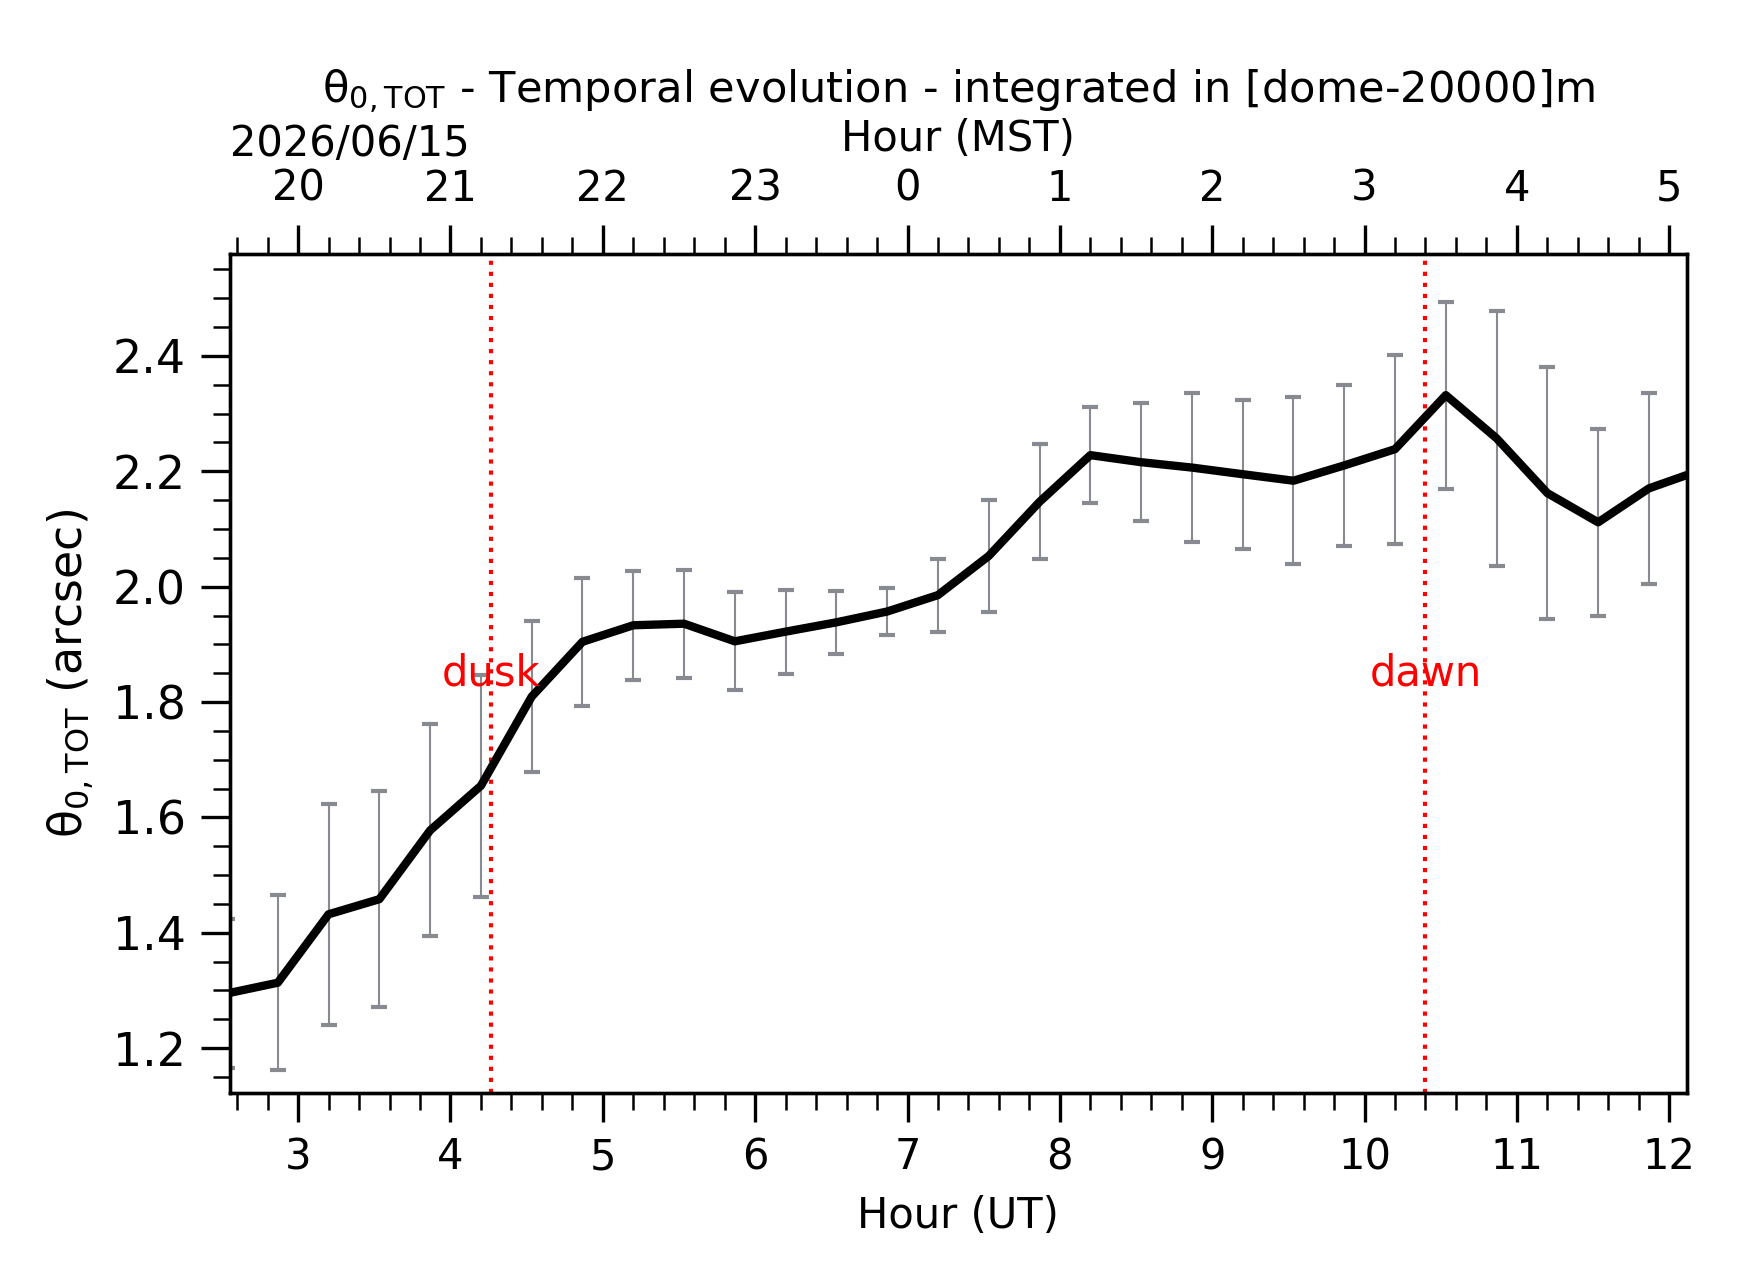
Fig. 1: Temporal evolution of θ0,TOT ([dome-20km]) between the sunset and the sunrise.