


Climatological analysis at Mt. Graham
Wind roses

|

|

|
|
Climatological wind rose measured on rear(*) mast at LBT (night + day) - Full year. |
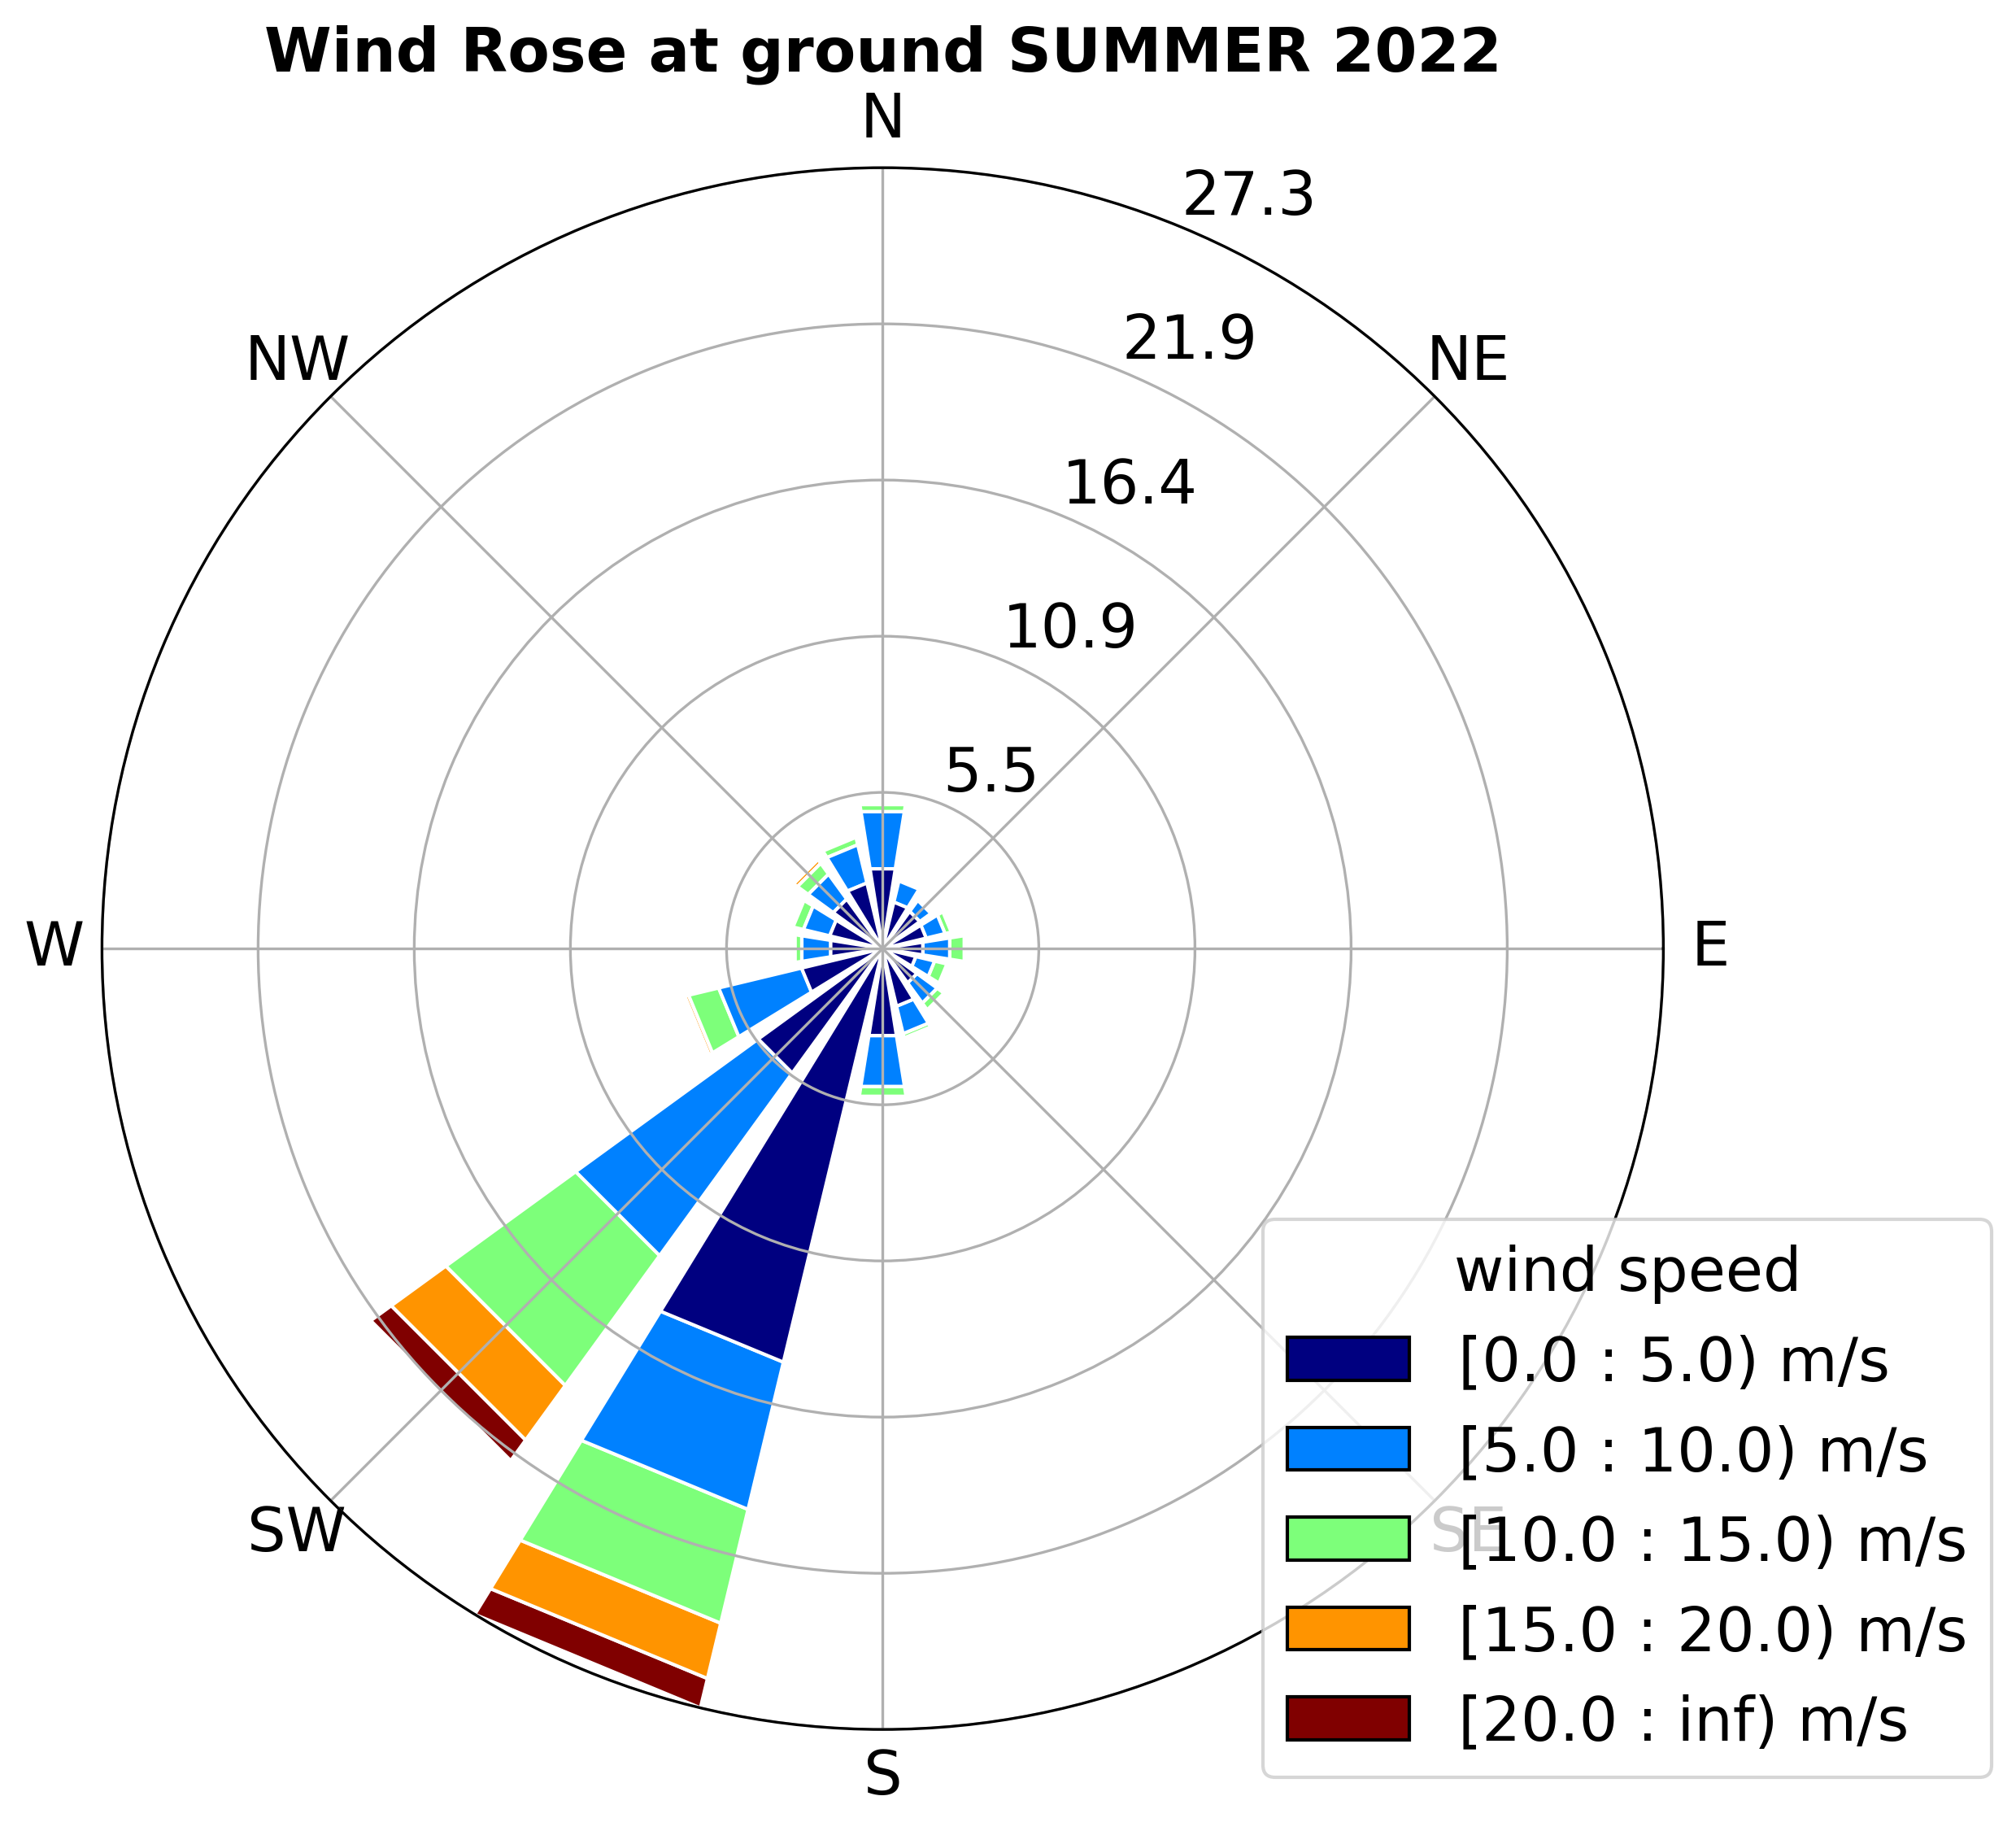
Climatological wind rose measured on rear mast at LBT (night + day) - Summer. |
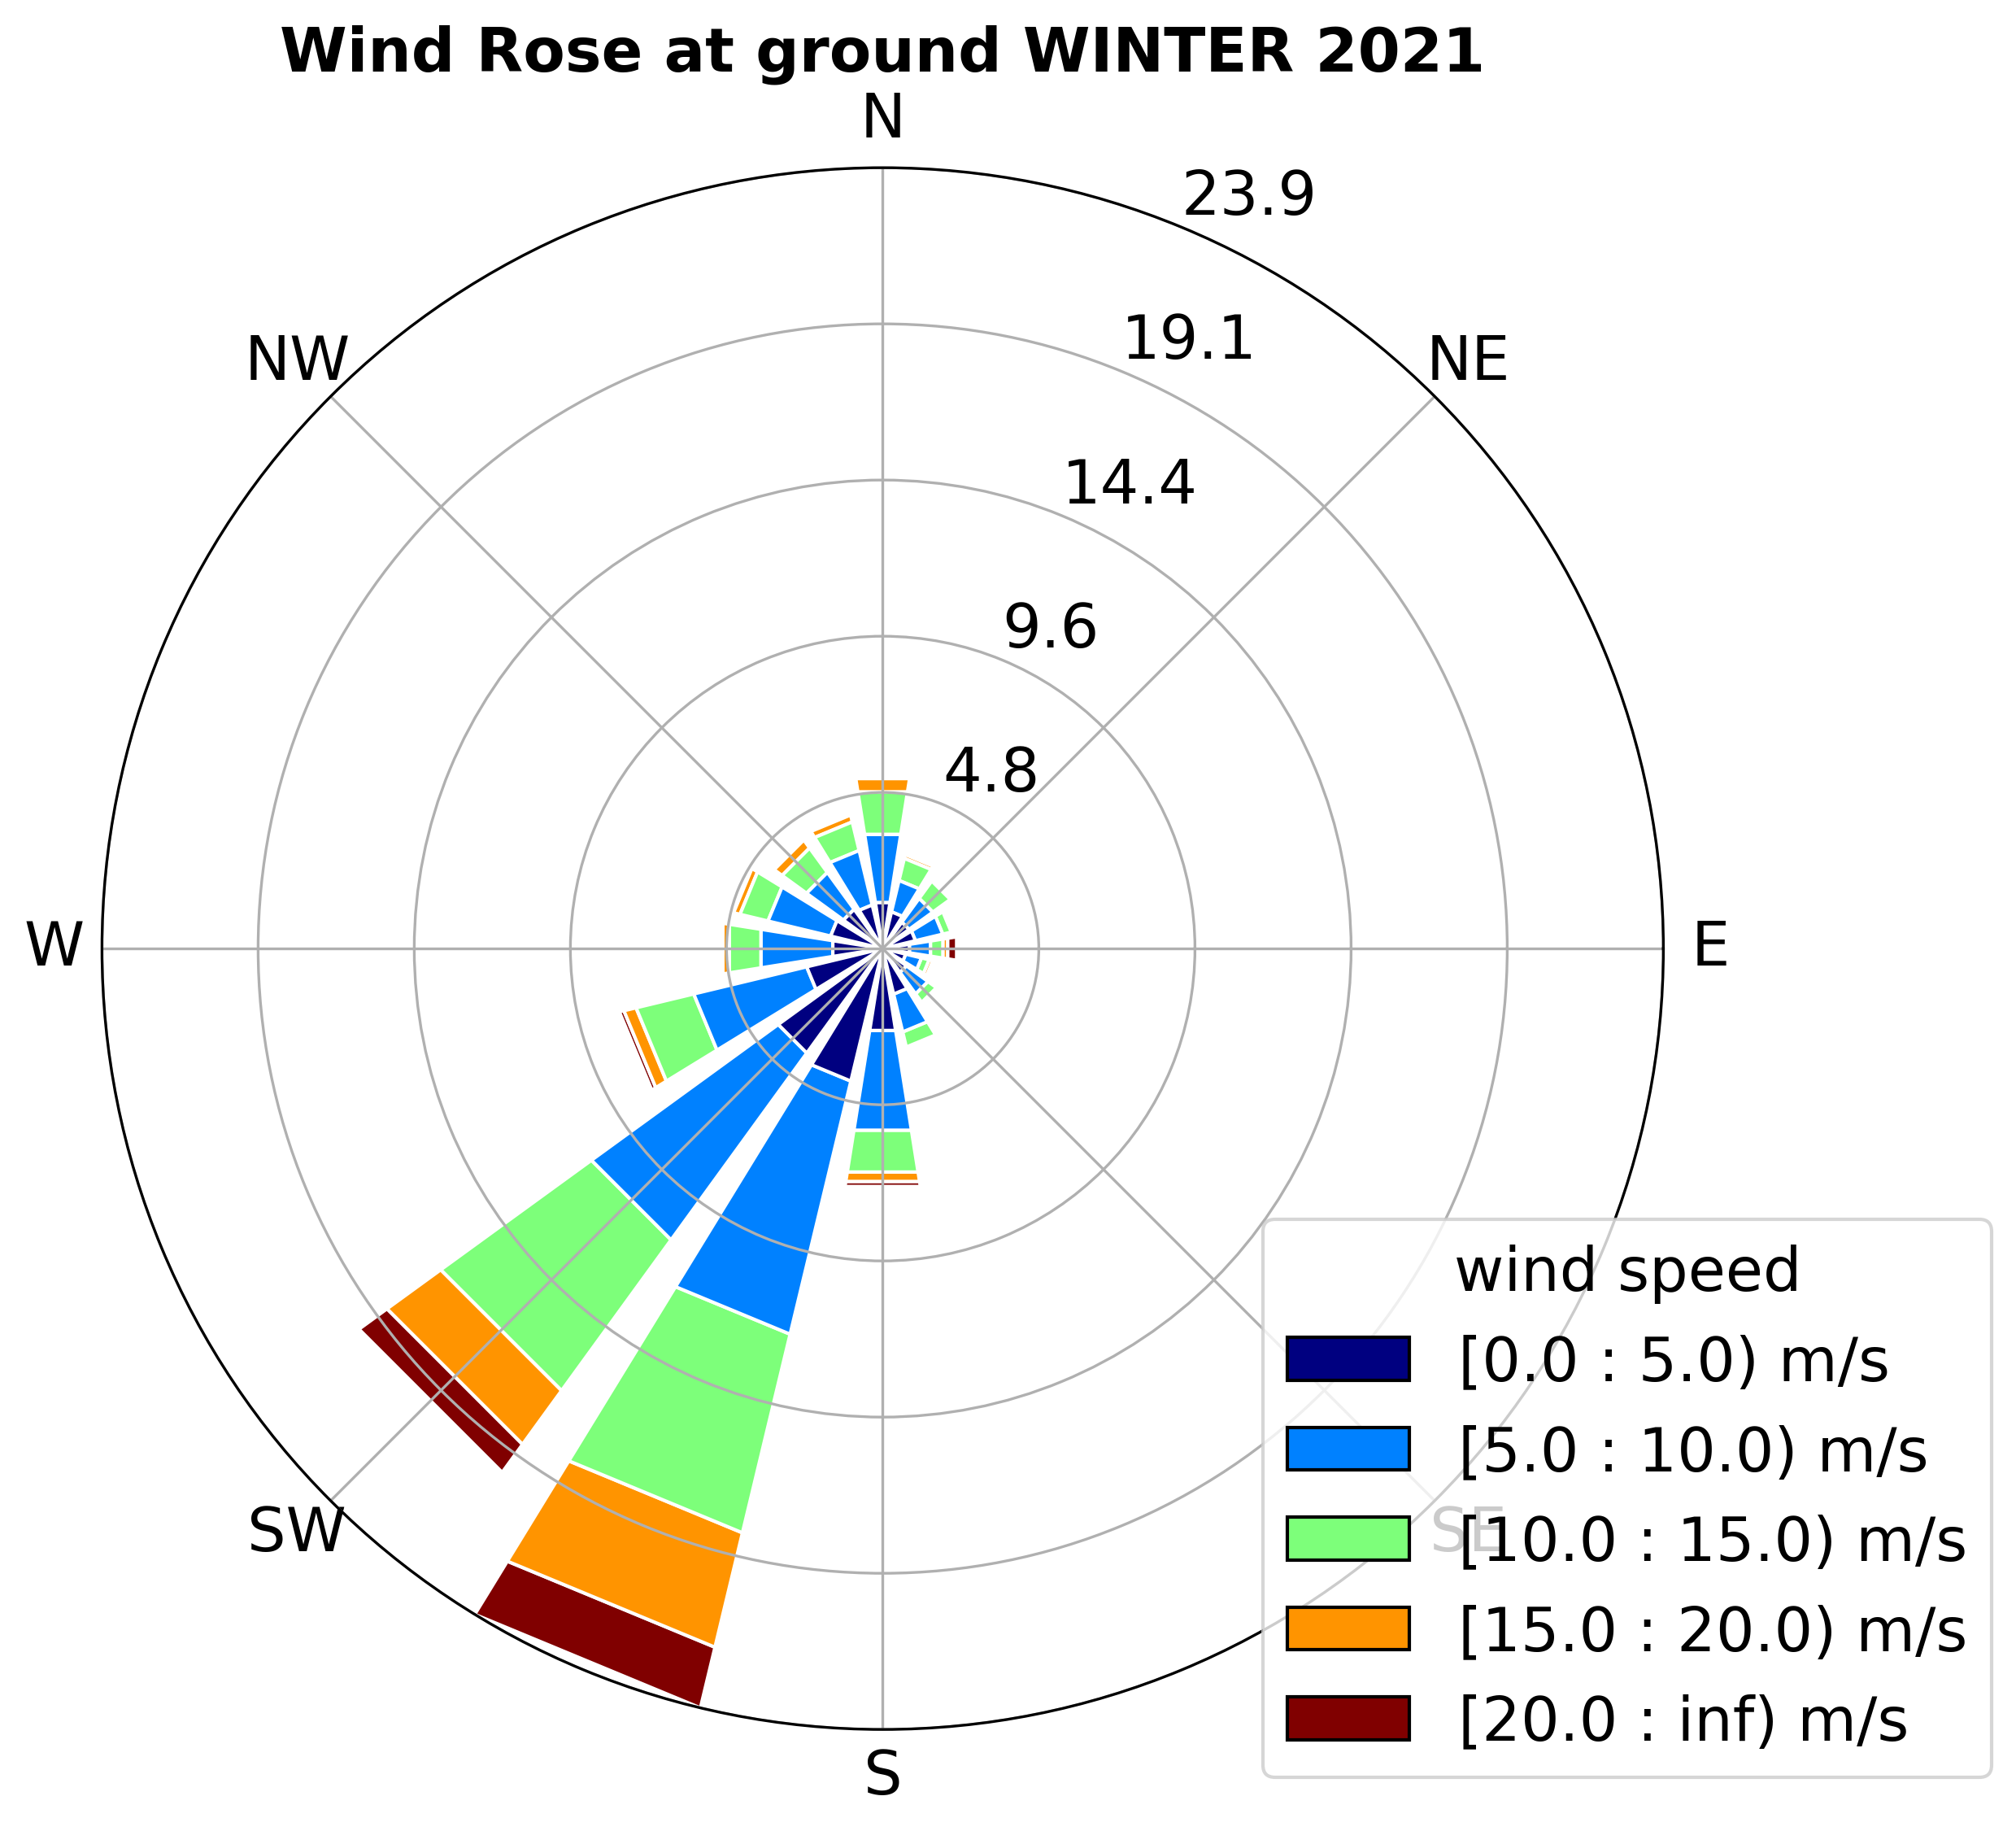
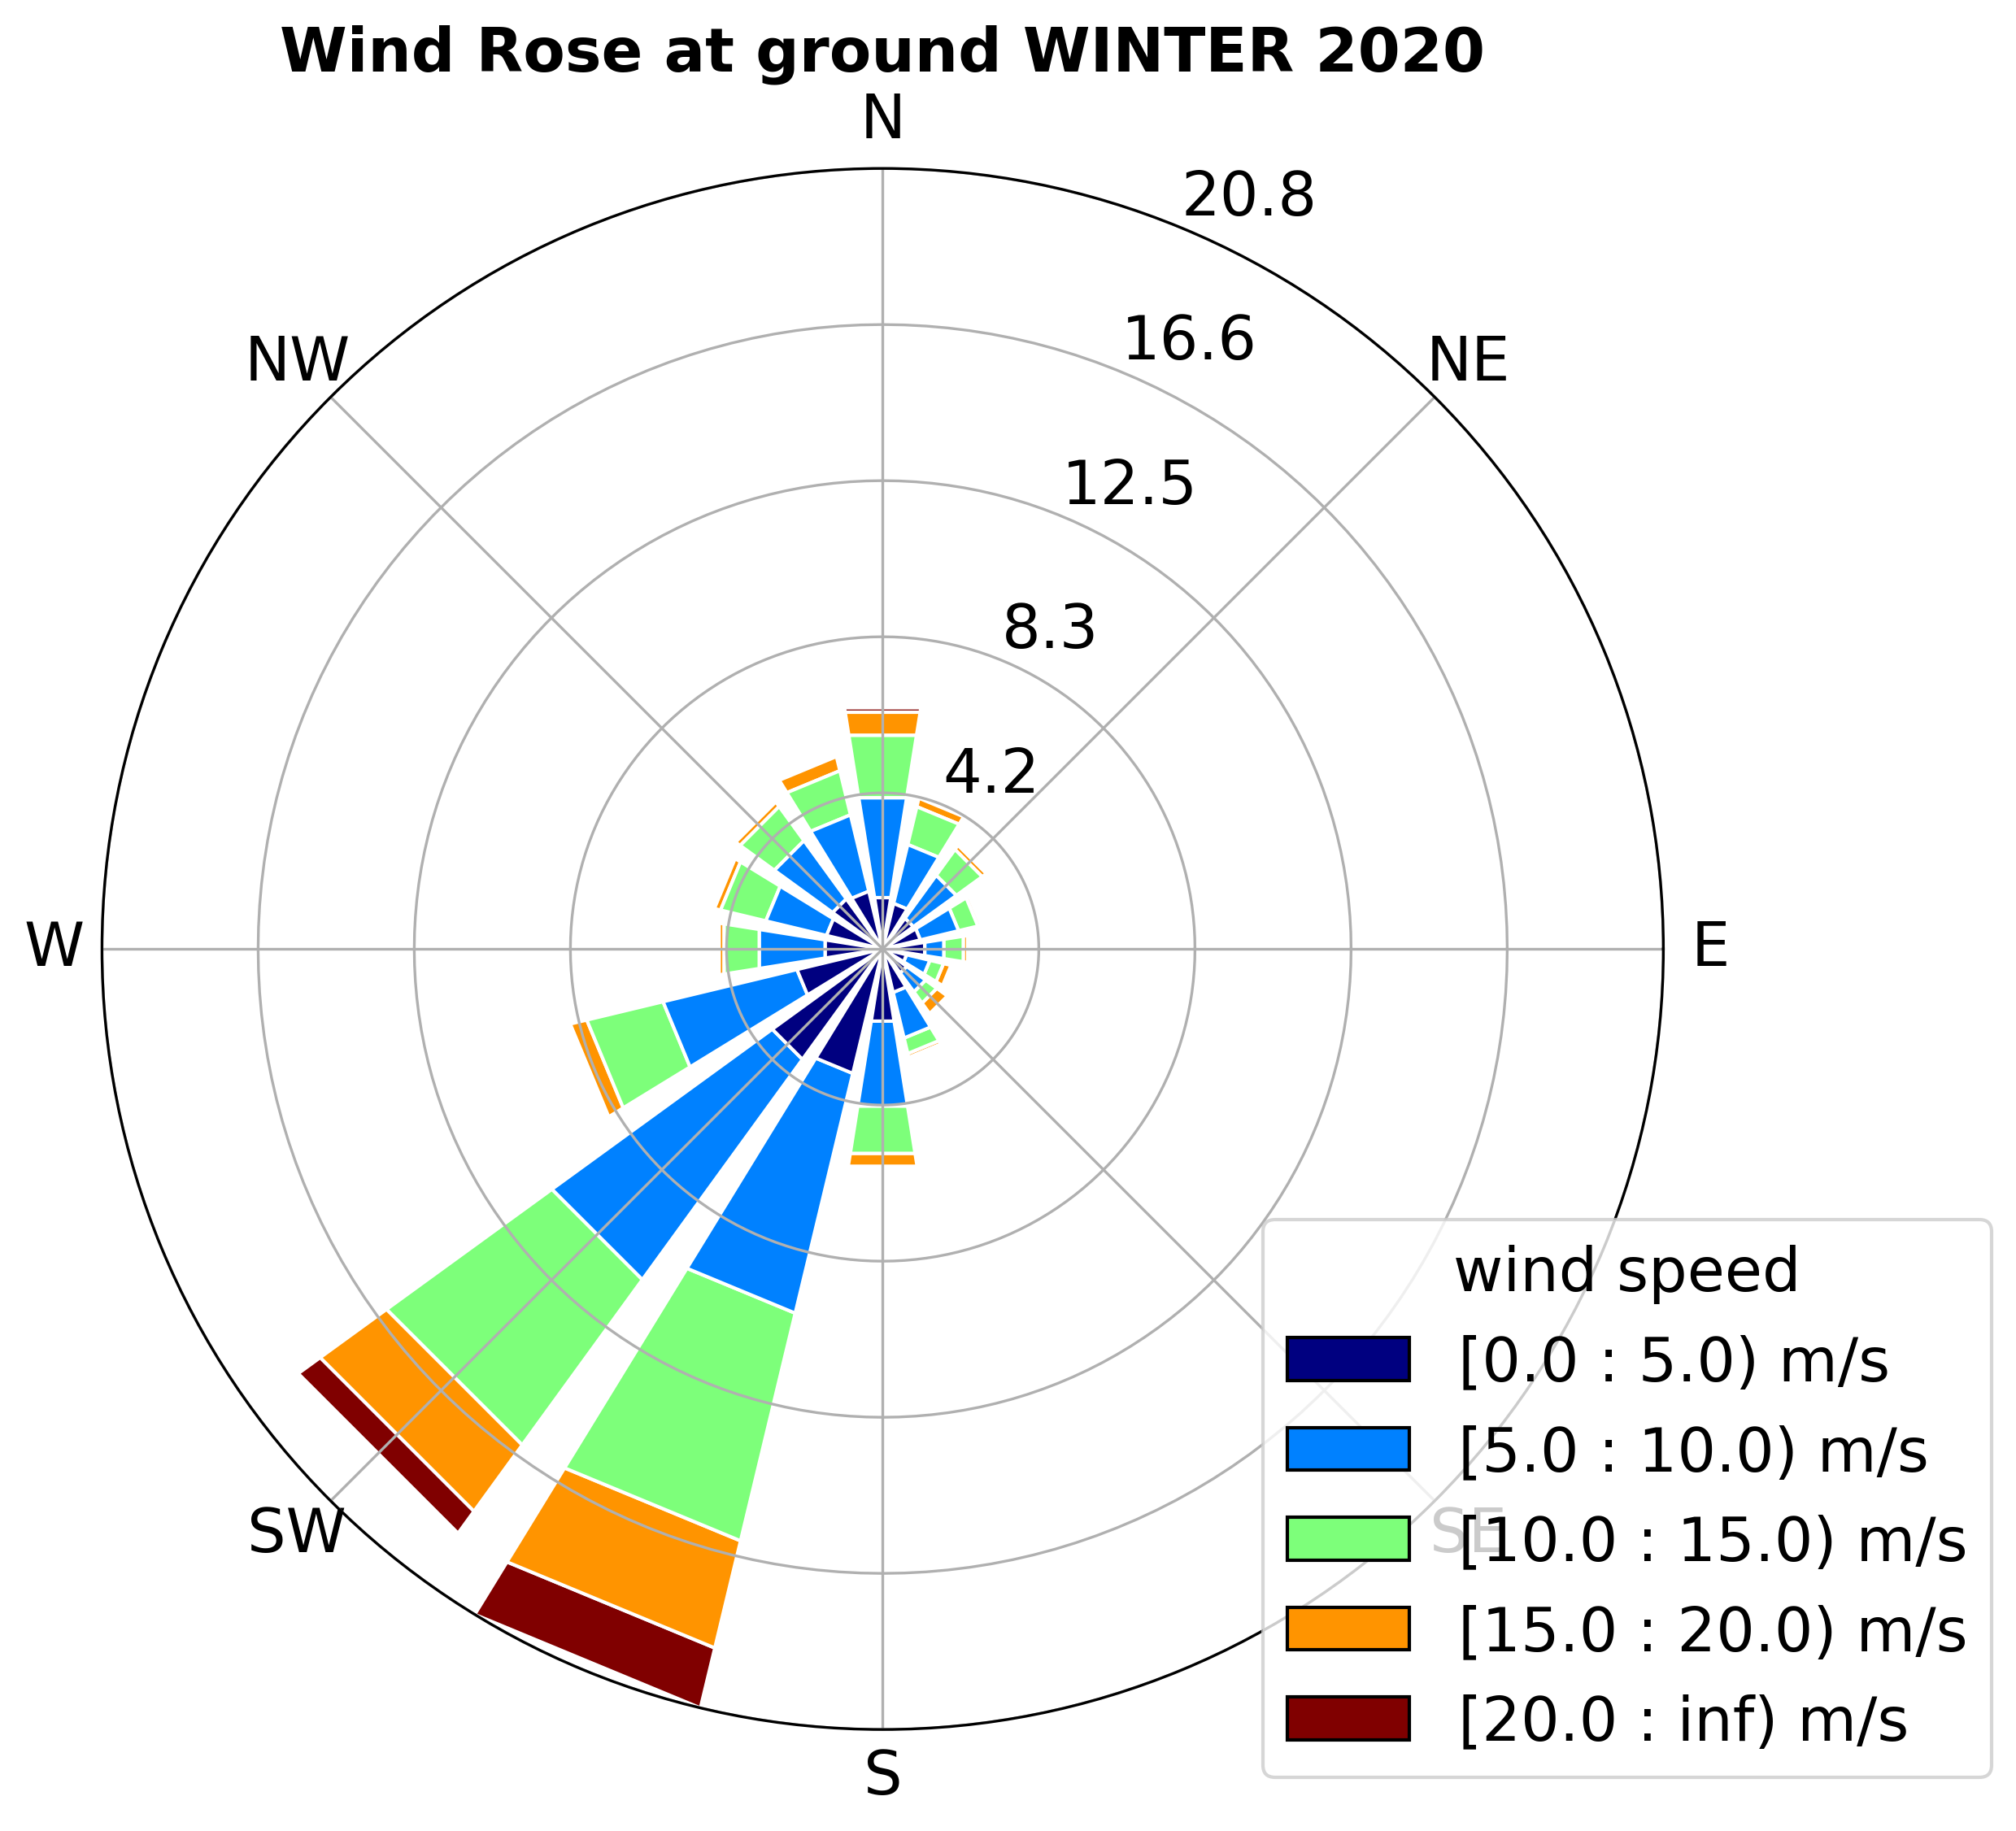
Climatological wind rose measured on rear mast at LBT (night + day) - Winter. |

|

|

|
|
Fig 13.1: Climatological wind rose measured on rear mast at LBT - Full year. Year 2025. |
Fig 13.2: Climatological wind rose measured on rear mast at LBT - Summer. Year 2025. |
Fig 13.3: Climatological wind rose measured on rear mast at LBT - Winter. Year 2025. |

|

|

|
|
Fig 12.1: Climatological wind rose measured on rear mast at LBT - Full year. Year 2024. |
Fig 12.2: Climatological wind rose measured on rear mast at LBT - Summer. Year 2024. |
Fig 12.3: Climatological wind rose measured on rear mast at LBT - Winter. Year 2024. |

|

|

|
|
Fig 11.1: Climatological wind rose measured on rear mast at LBT - Full year. Year 2023. |
Fig 11.2: Climatological wind rose measured on rear mast at LBT - Summer. Year 2023. |
Fig 11.3: Climatological wind rose measured on rear mast at LBT - Winter. Year 2023. |

|
|

|
|
Fig 10.1: Climatological wind rose measured on rear mast at LBT - Full year. Year 2022. |
Fig 10.2: Climatological wind rose measured on rear mast at LBT - Summer. Year 2022. |
Fig 10.3: Climatological wind rose measured on rear mast at LBT - Winter. Year 2022. |

|

|
|
|
Fig 9.1: Climatological wind rose measured on rear mast at LBT - Full year. Year 2021. |
Fig 9.2: Climatological wind rose measured on rear mast at LBT - Summer. Year 2021. |
Fig 9.3: Climatological wind rose measured on rear mast at LBT - Winter. Year 2021. |

|

|
|
|
Fig 8.1: Climatological wind rose measured on rear mast at LBT - Full year. Year 2020. |
Fig 8.2: Climatological wind rose measured on rear mast at LBT - Summer. Year 2020. |
Fig 8.3: Climatological wind rose measured on rear mast at LBT - Winter. Year 2020. |

|

|

|
|
Fig 7.1: Climatological wind rose measured on rear mast at LBT - Full year. Year 2019. |
Fig 7.2: Climatological wind rose measured on rear mast at LBT - Summer. Year 2019. |
Fig 7.3: Climatological wind rose measured on rear mast at LBT - Winter. Year 2019. |

|

|

|
|
Fig 6.1: Climatological wind rose measured on rear mast at LBT - Full year. Year 2018. |
Fig 6.3: Climatological wind rose measured on rear mast at LBT - Summer. Year 2018. |
Fig 6.3: Climatological wind rose measured on rear mast at LBT - Winter. Year 2018. |

|
|

|
|
Fig 5.1: Climatological wind rose measured on rear mast at LBT - Full year. Year 2017. |
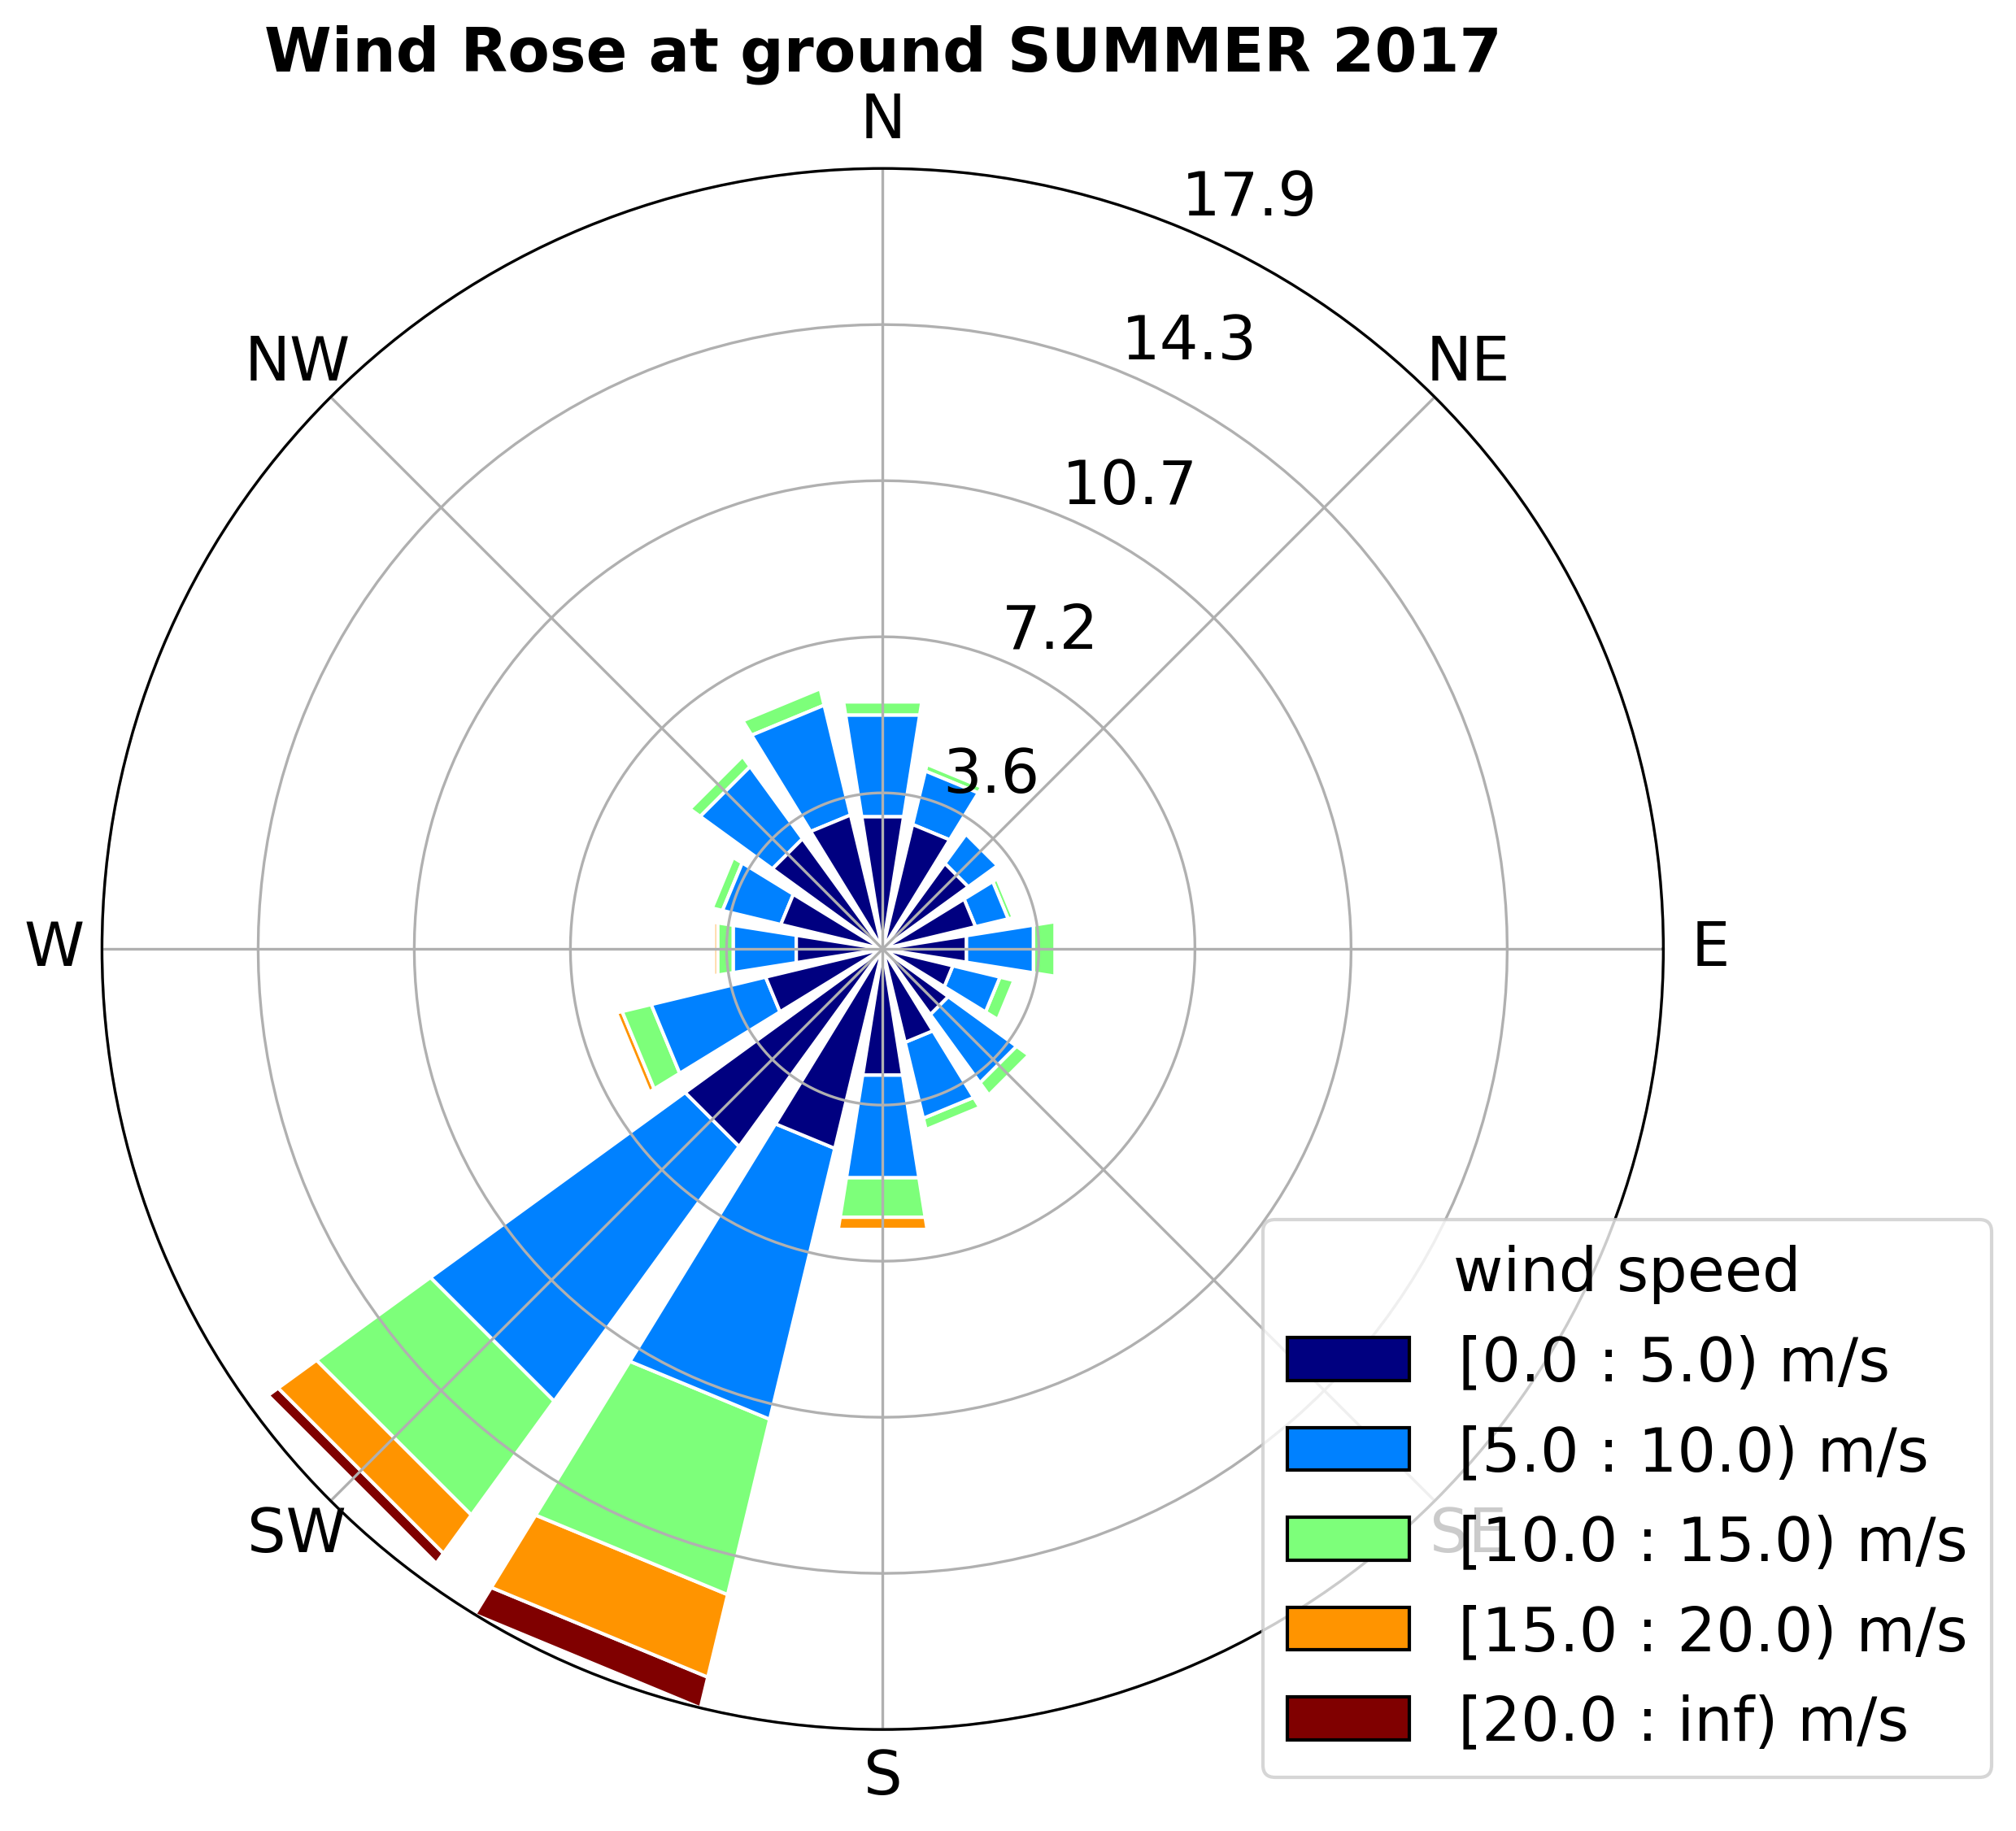
Fig 5.2: Climatological wind rose measured on rear mast at LBT - Summer. Year 2017. |
Fig 5.3: Climatological wind rose measured on rear mast at LBT - Winter. Year 2017. |

|
|

|
|
Fig 4.1: Climatological wind rose measured on rear mast at LBT - Full year. Year 2016. |
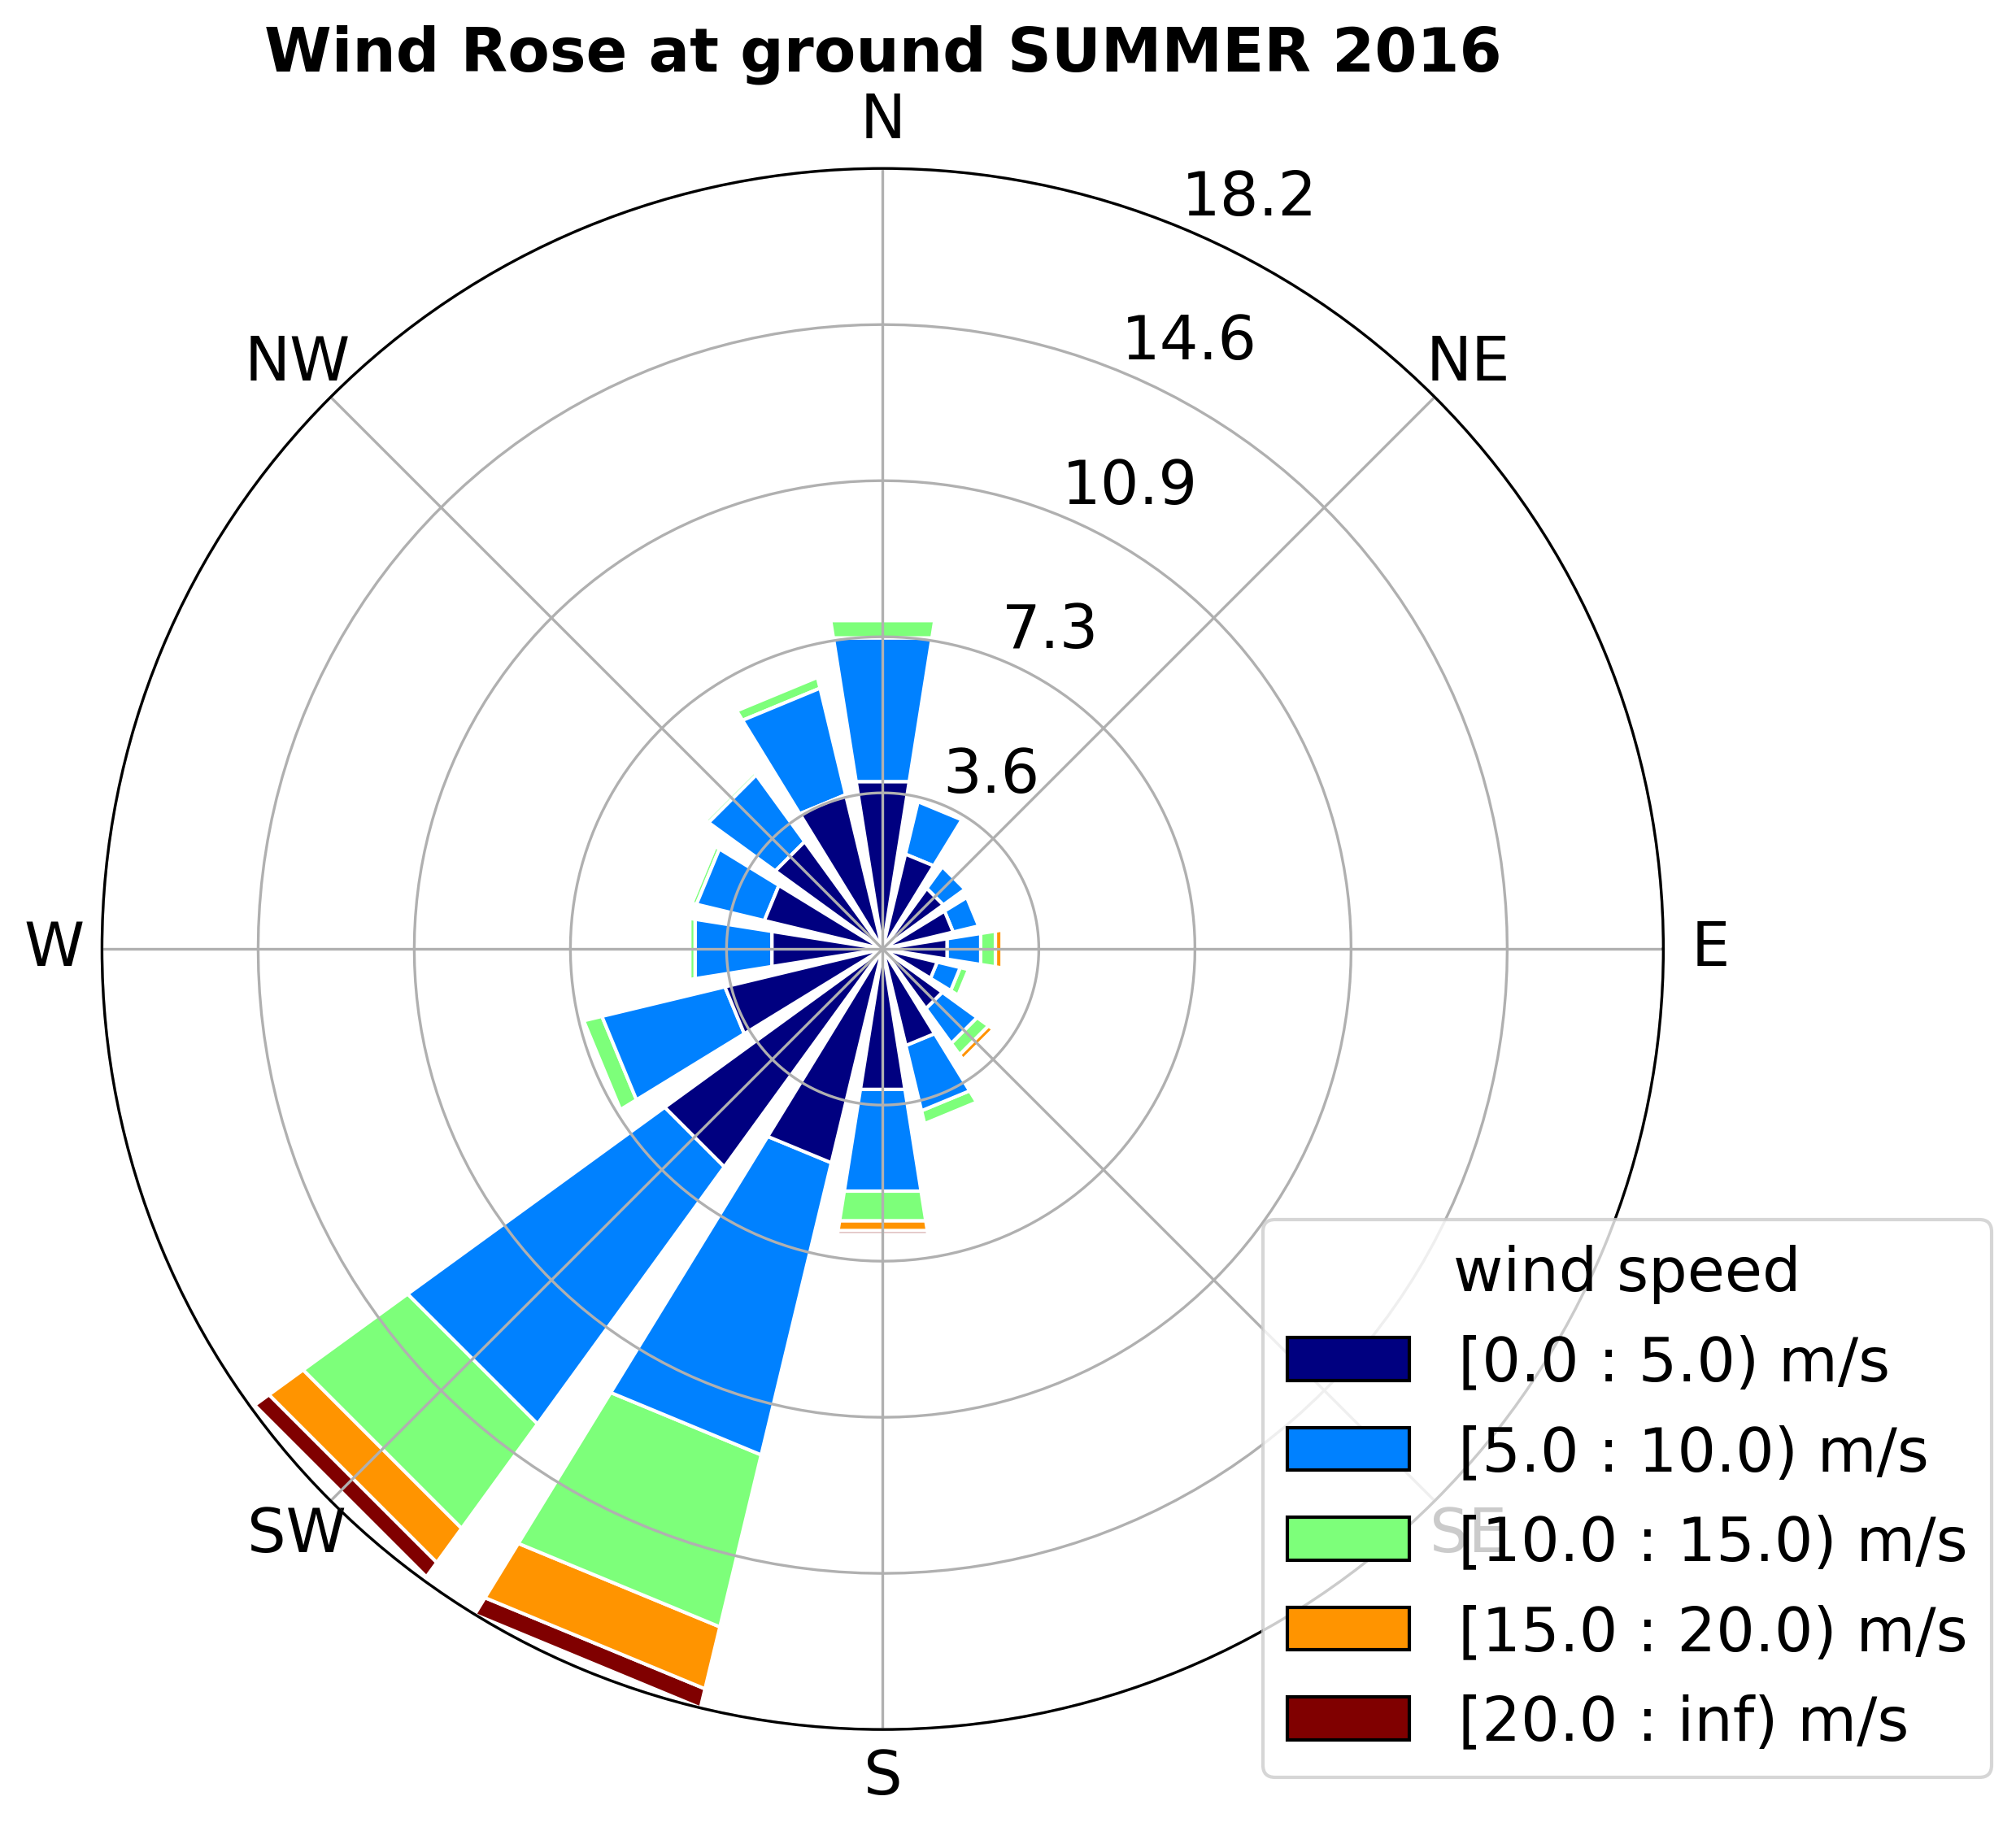
Fig 4.2: Climatological wind rose measured on rear mast at LBT - Summer. Year 2016. |
Fig 4.3: Climatological wind rose measured on rear mast at LBT - Winter. Year 2016. |

|
|

|
|
Fig 3.1: Climatological wind rose measured on rear mast at LBT - Full year. Year 2015. |
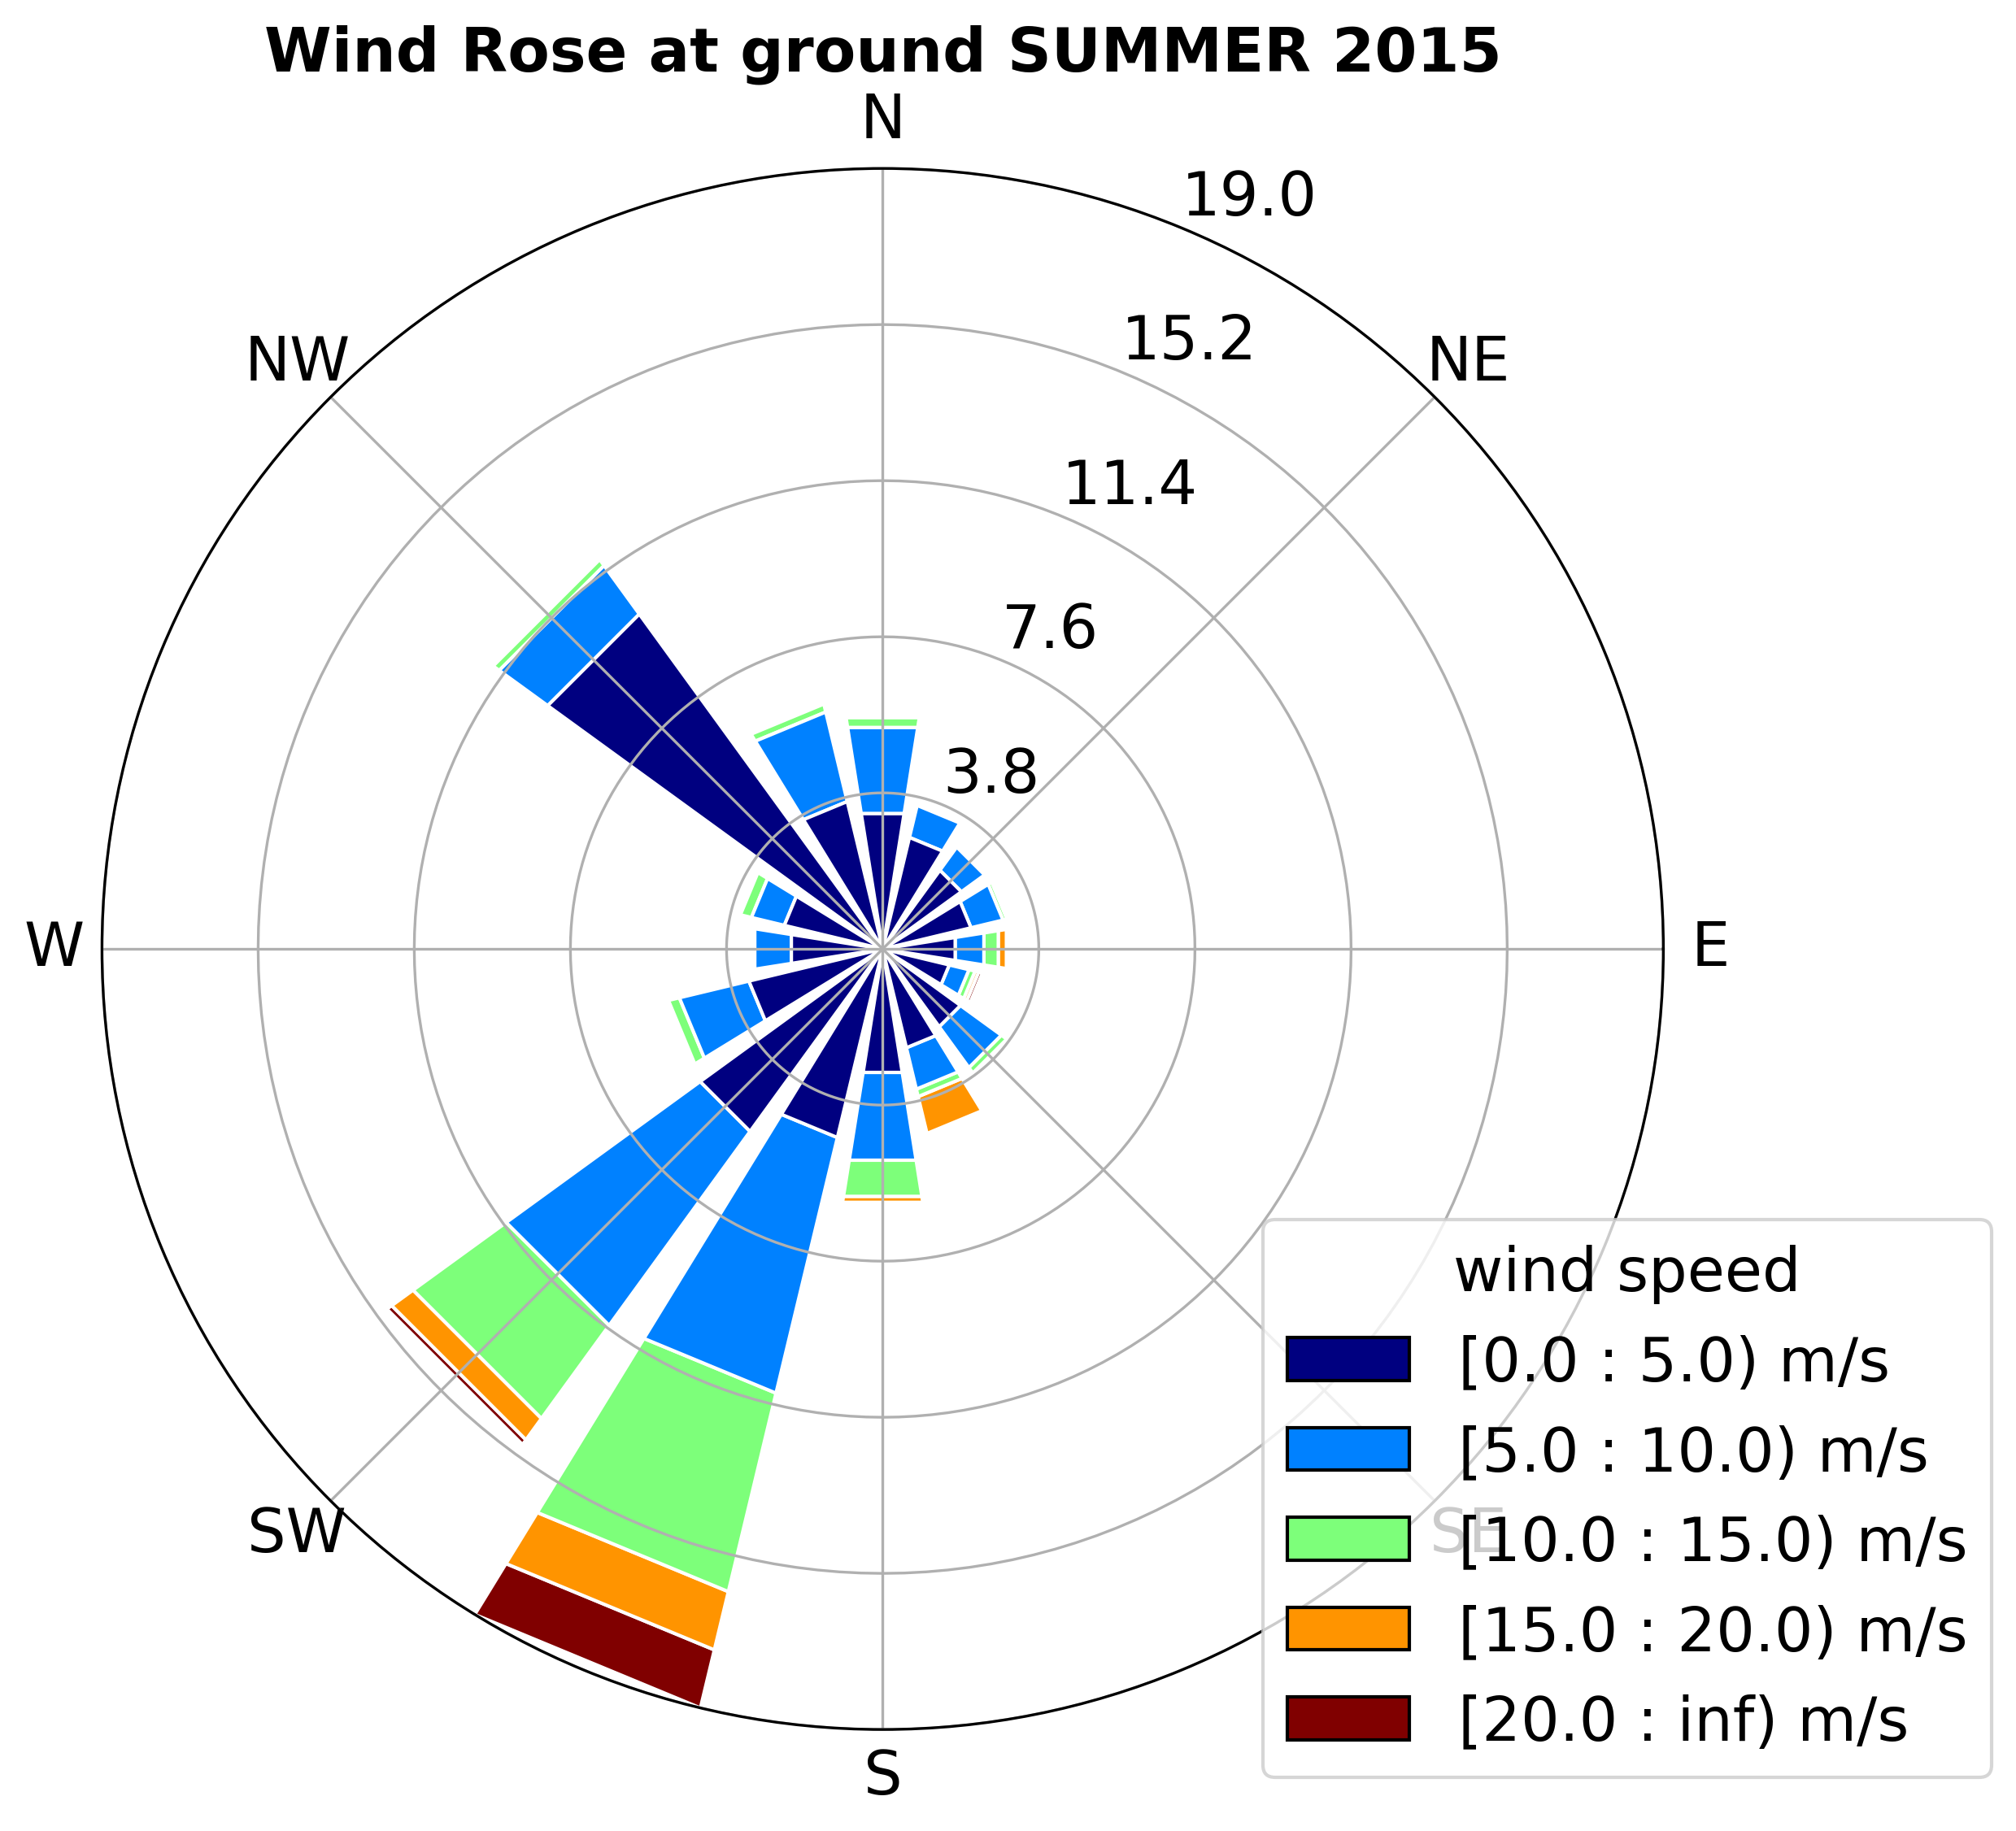
Fig 3.2: Climatological wind rose measured on rear mast at LBT - Summer. Year 2015. |
Fig 3.3: Climatological wind rose measured on rear mast at LBT - Winter. Year 2015. |

|

|

|
|
Fig 2.1: Climatological wind rose measured on rear mast at LBT - Full year. Year 2014. |
Fig 2.2: Climatological wind rose measured on rear mast at LBT - Summer. Year 2014. |
Fig 2.3: Climatological wind rose measured on rear mast at LBT - Winter. Year 2014. |

|

|
|
|
Fig 1.1: Climatological wind rose measured on rear mast at LBT - Full year. Year 2013. |
Fig 1.2: Climatological wind rose measured on rear mast at LBT - Summer. Year 2013. |
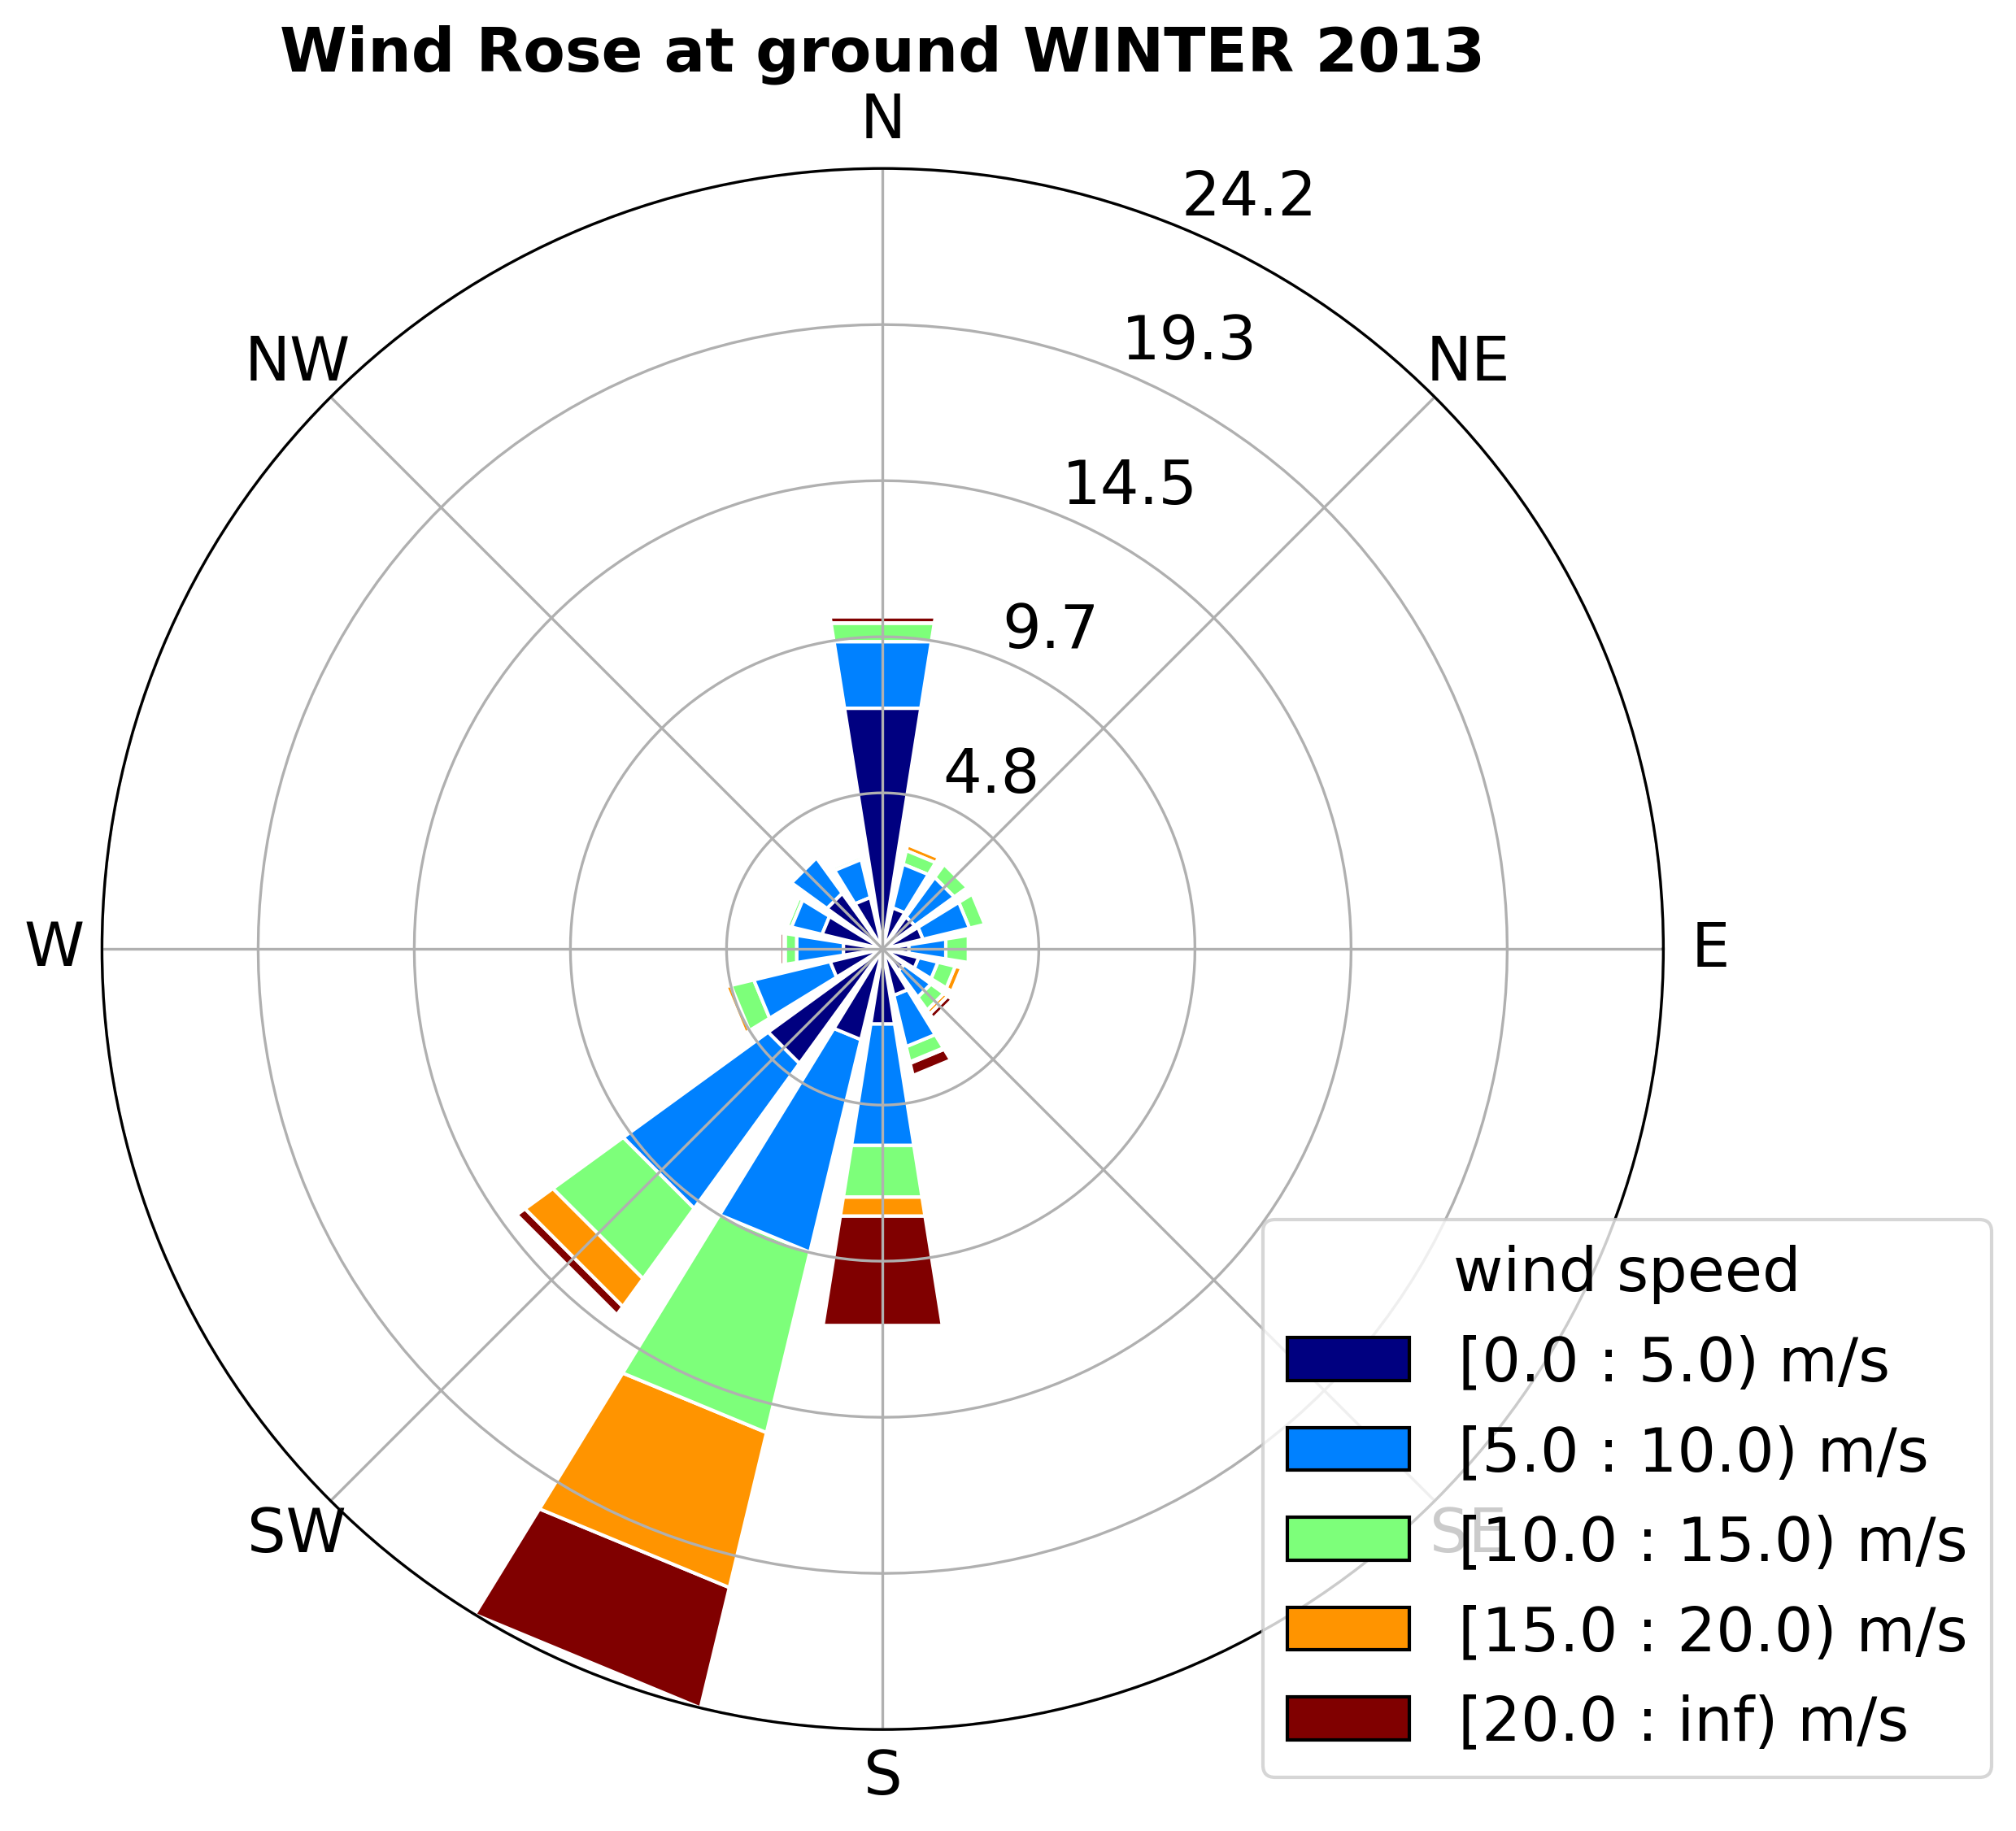
Fig 1.3: Climatological wind rose measured on rear mast at LBT - Winter. Year 2013. |
* It has been observed that front sensors provide biased measurements (for the wind speed and direction) when the telescope is closed. Still not clear the reason but because of that, we considered measurements only from the rear sensor for the climatology estimate.